

Skin Exhibit
California Academy of Sciences,
San Francisco
2019
Two interactive apps for an exhibit about animal and human skin. The exhibit explores the science of skin, the range of skins in nature, the social impacts of skin color.

In an exhibit about animal and human skin, this interactive screen discussed the relationship between skin tone and ethnic identity through the lens of the U.S. Census from 1790-2000.

Installation of the screen and the graphics surrounding the interactive.

Installation of the screen and the graphics surrounding the interactive.
GIF showing each of the content groups in this interactive about the census.

Home screen. Photos of the seven individuals who are used as a lens to explore the US census.
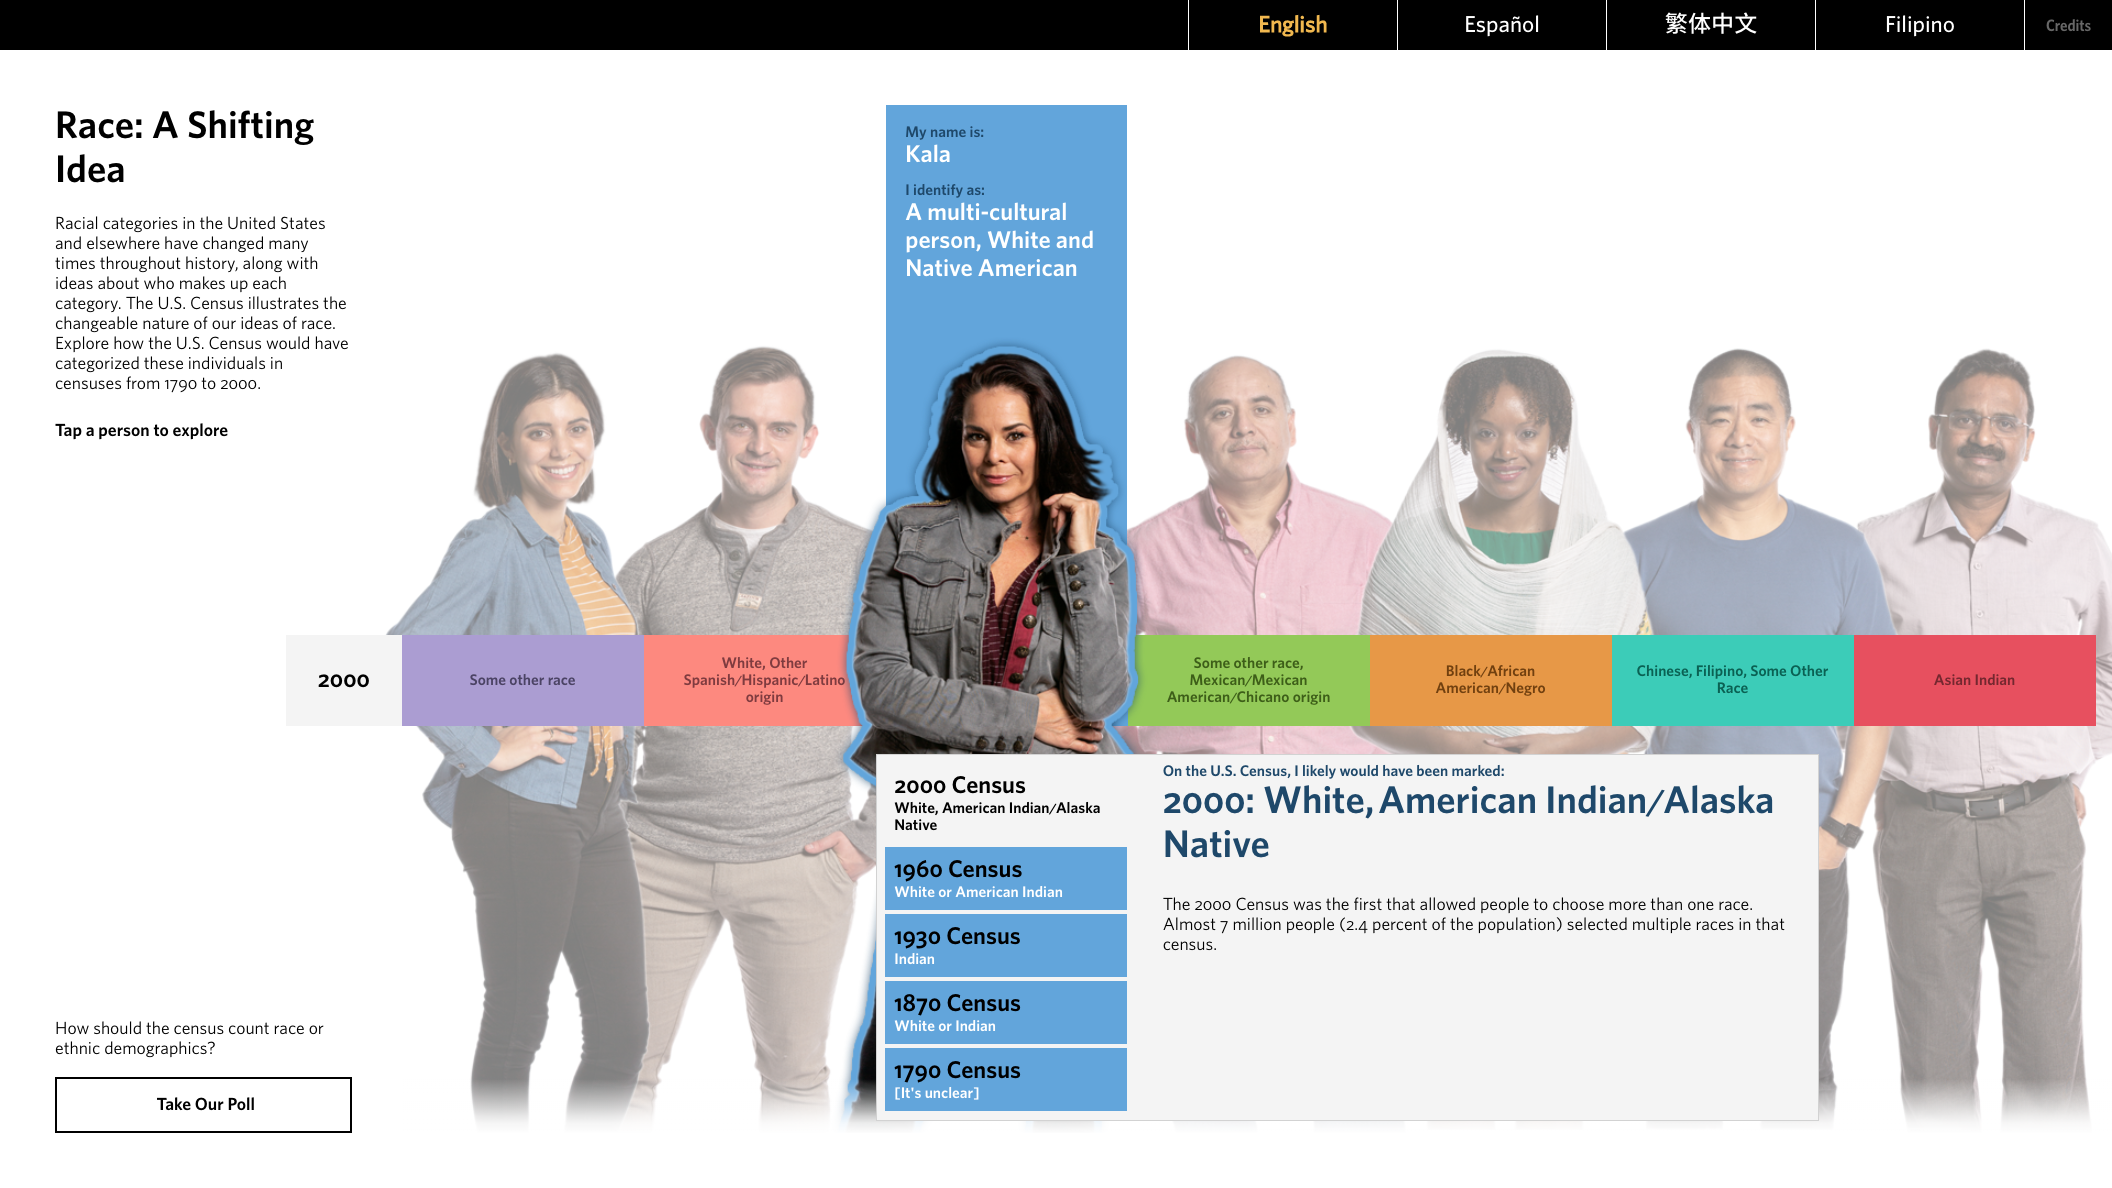
2000 Census

1960 Census

1930 Census
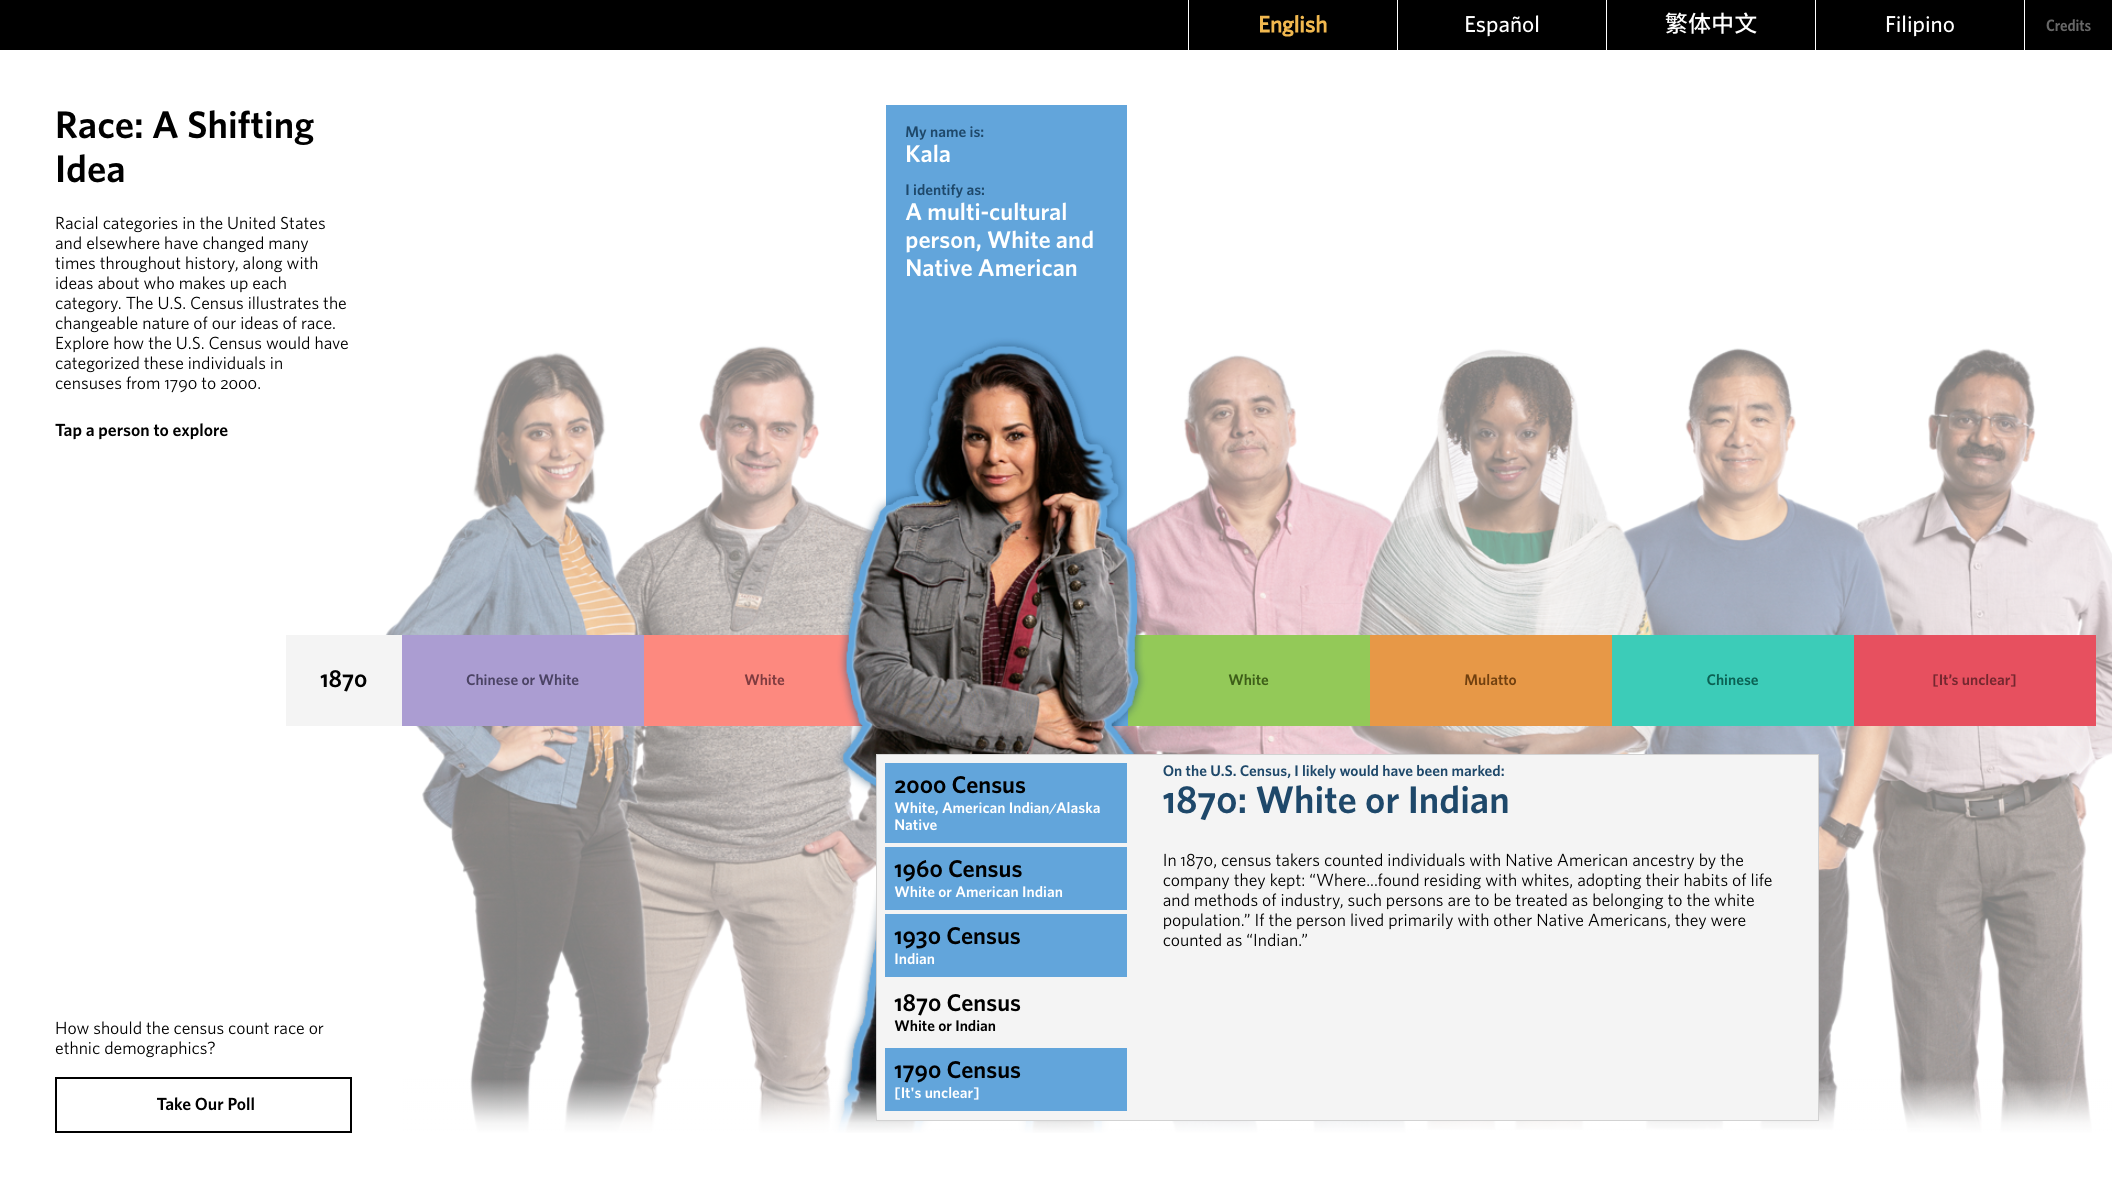
1870 Census

1790 Census – the first census
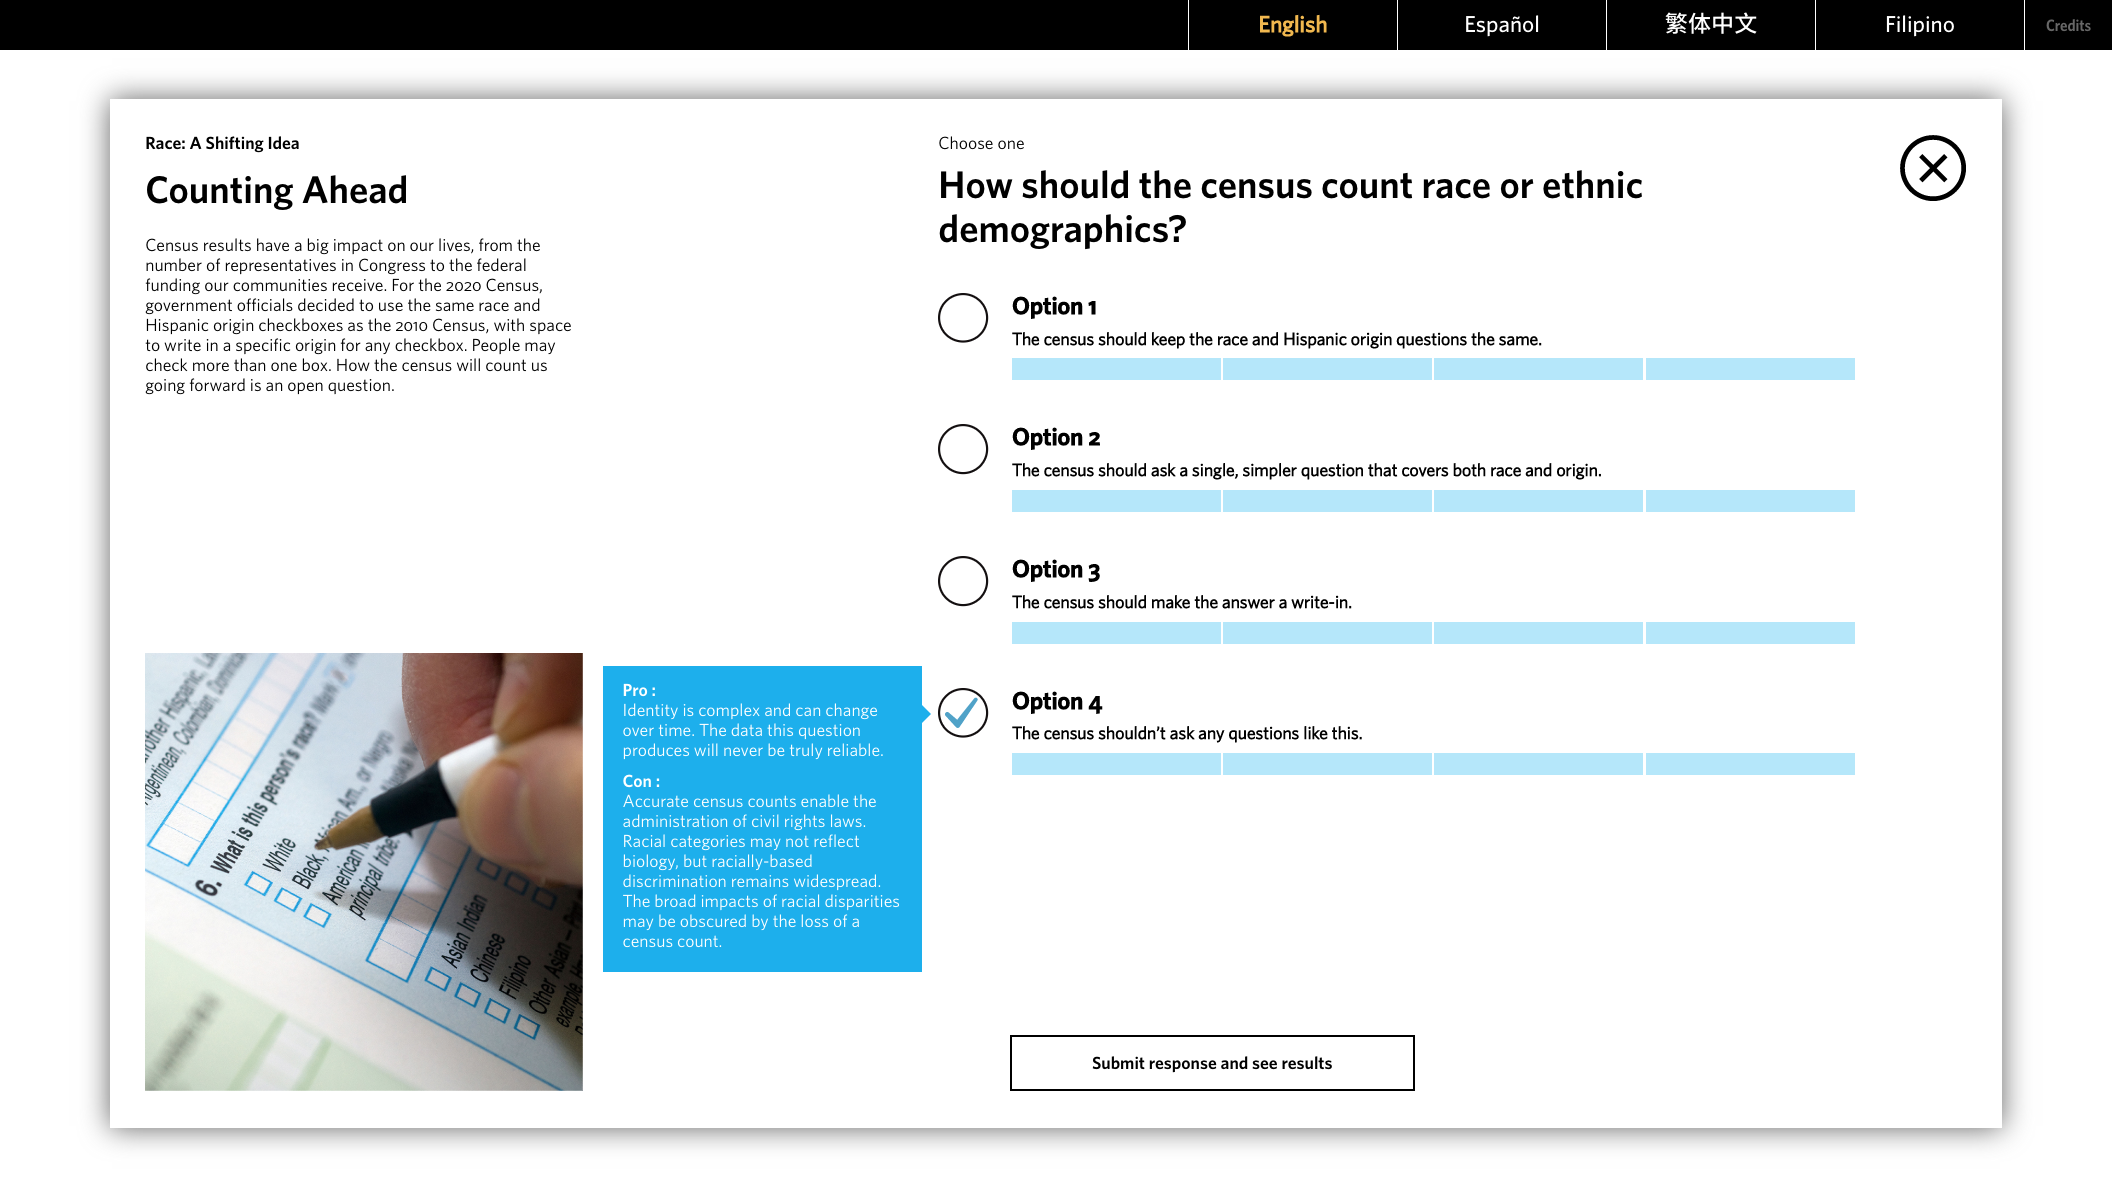
Accessed by button in the bottom right corner. The visitor could vote about how demographics could be counted. Pros and Cons included for all options.
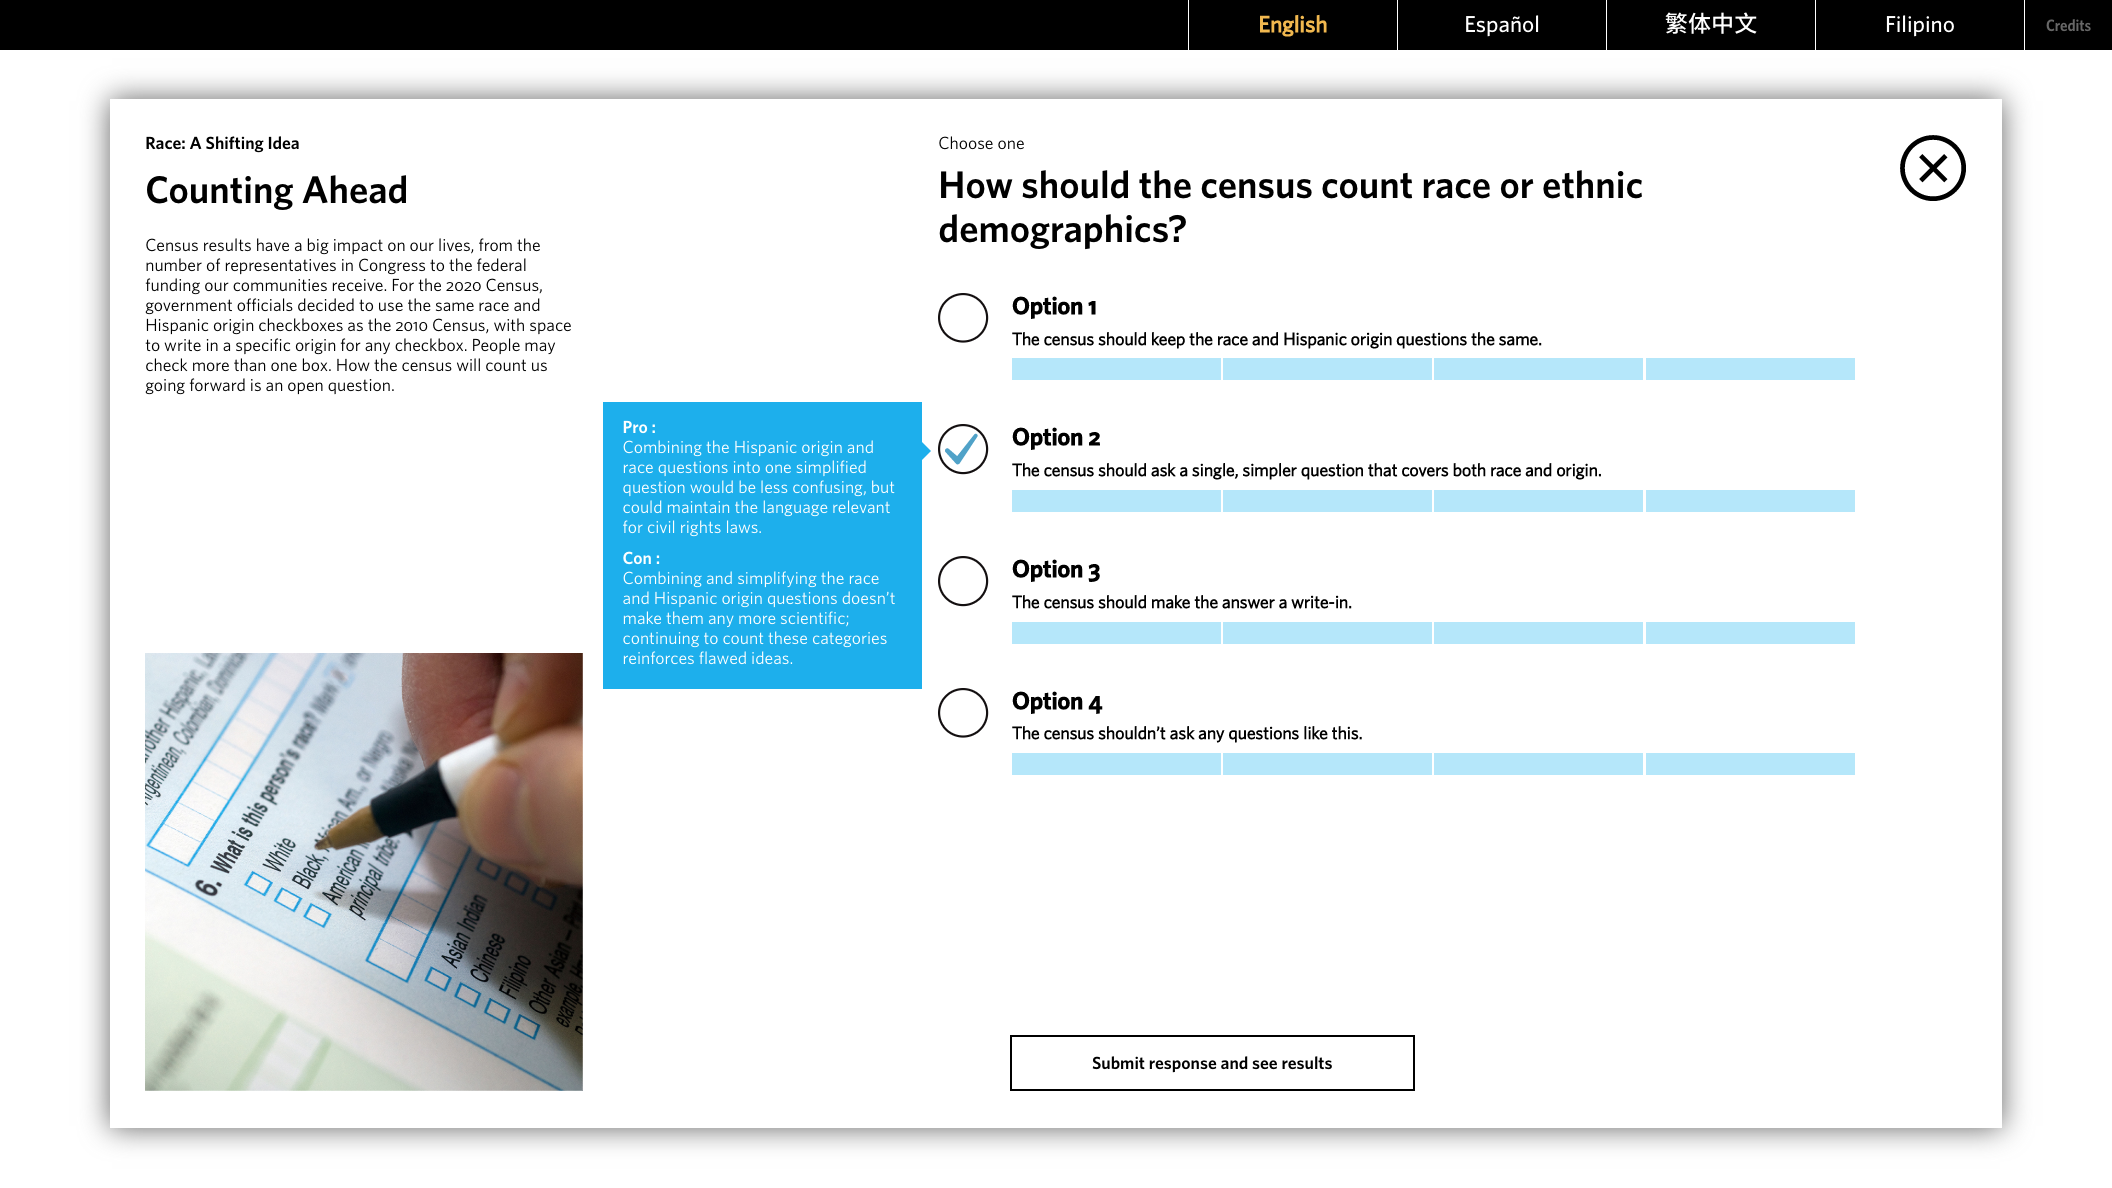
Accessed by button in the bottom right corner. The visitor could vote about how demographics could be counted. Pros and Cons included for all options.
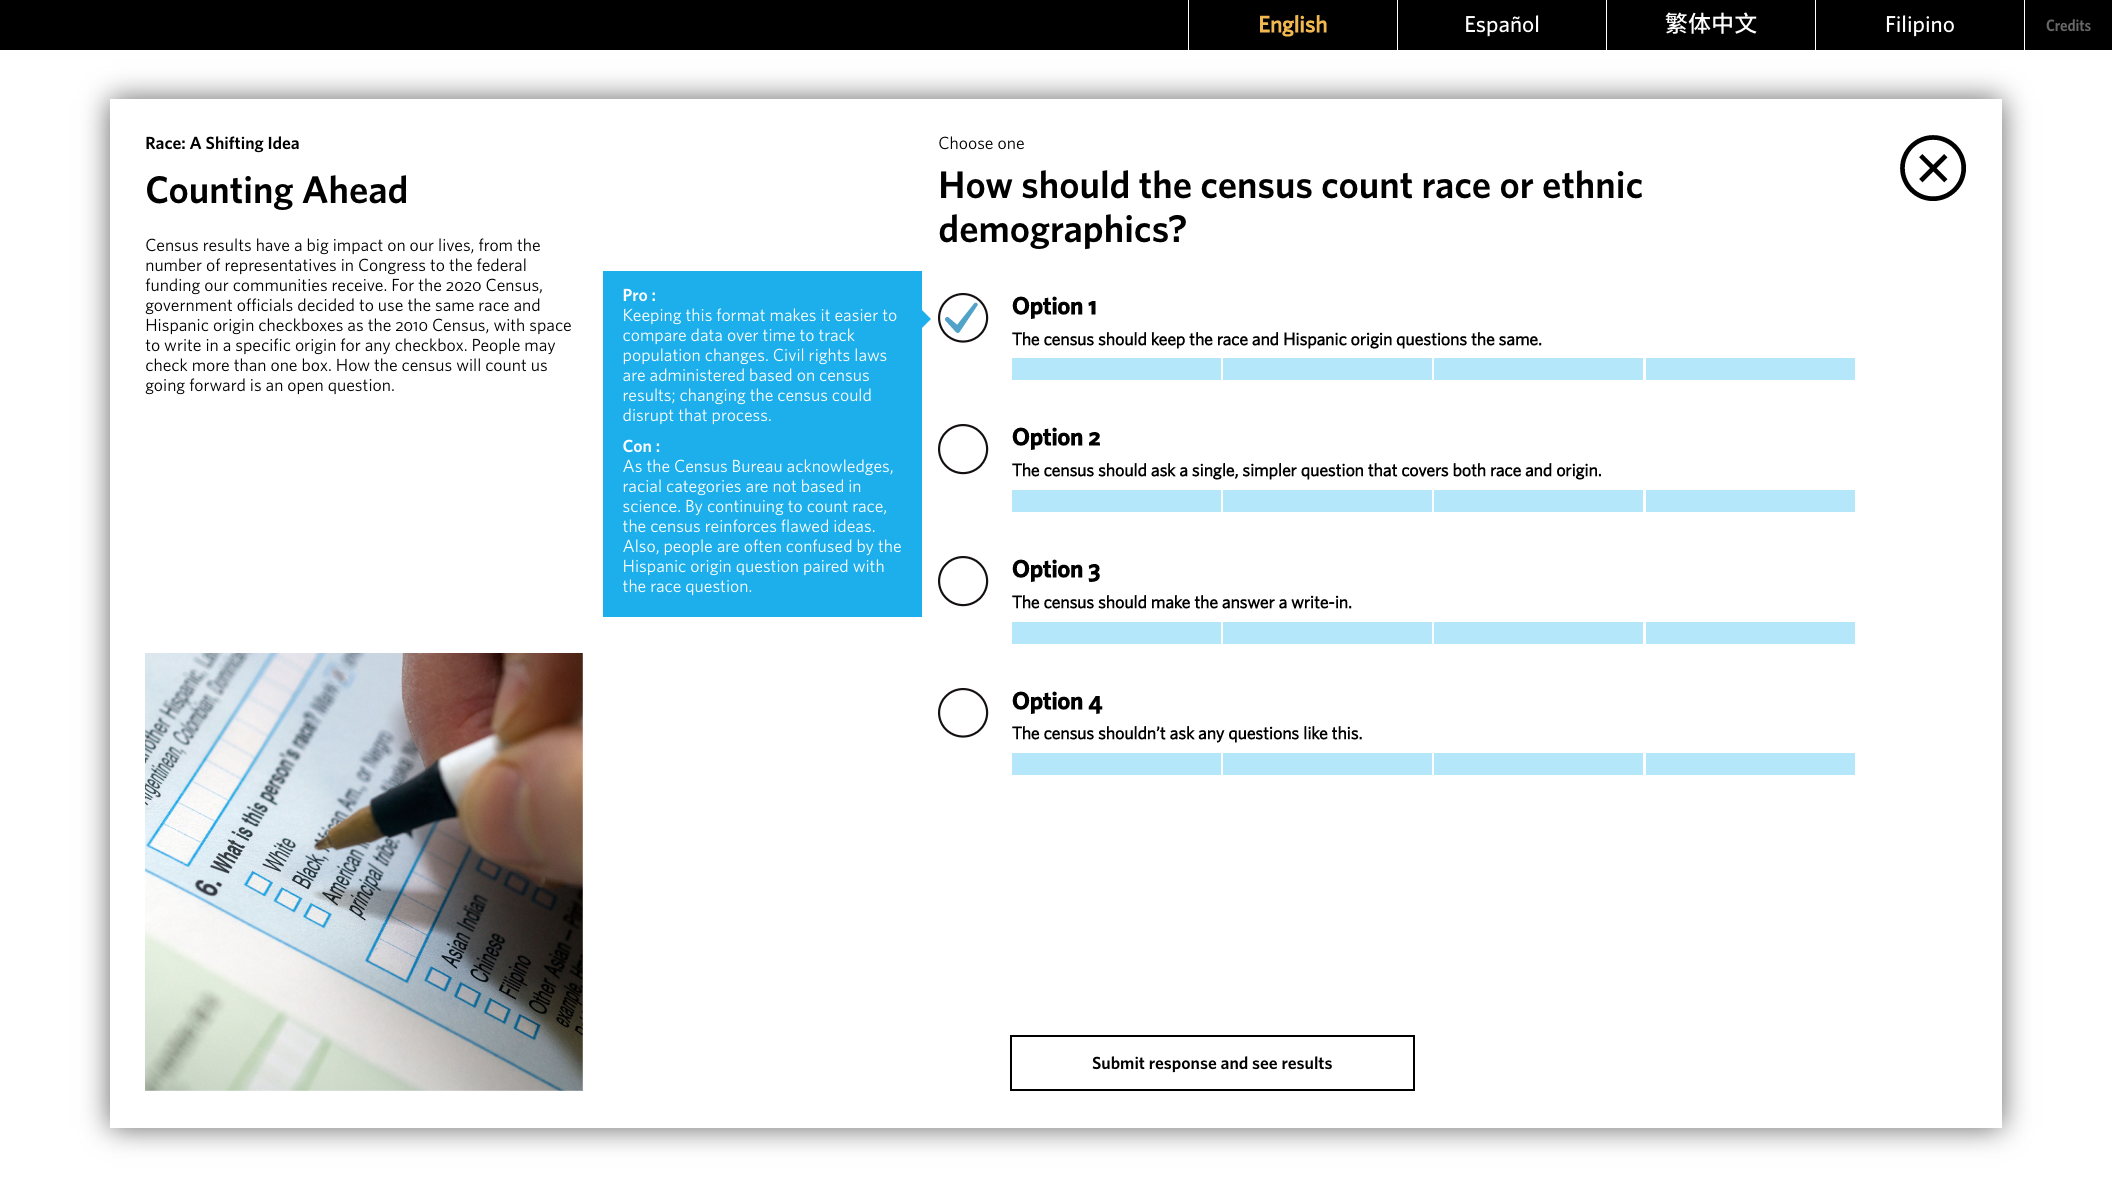
Accessed by button in the bottom right corner. The visitor could vote about how demographics could be counted. Pros and Cons included for all options.
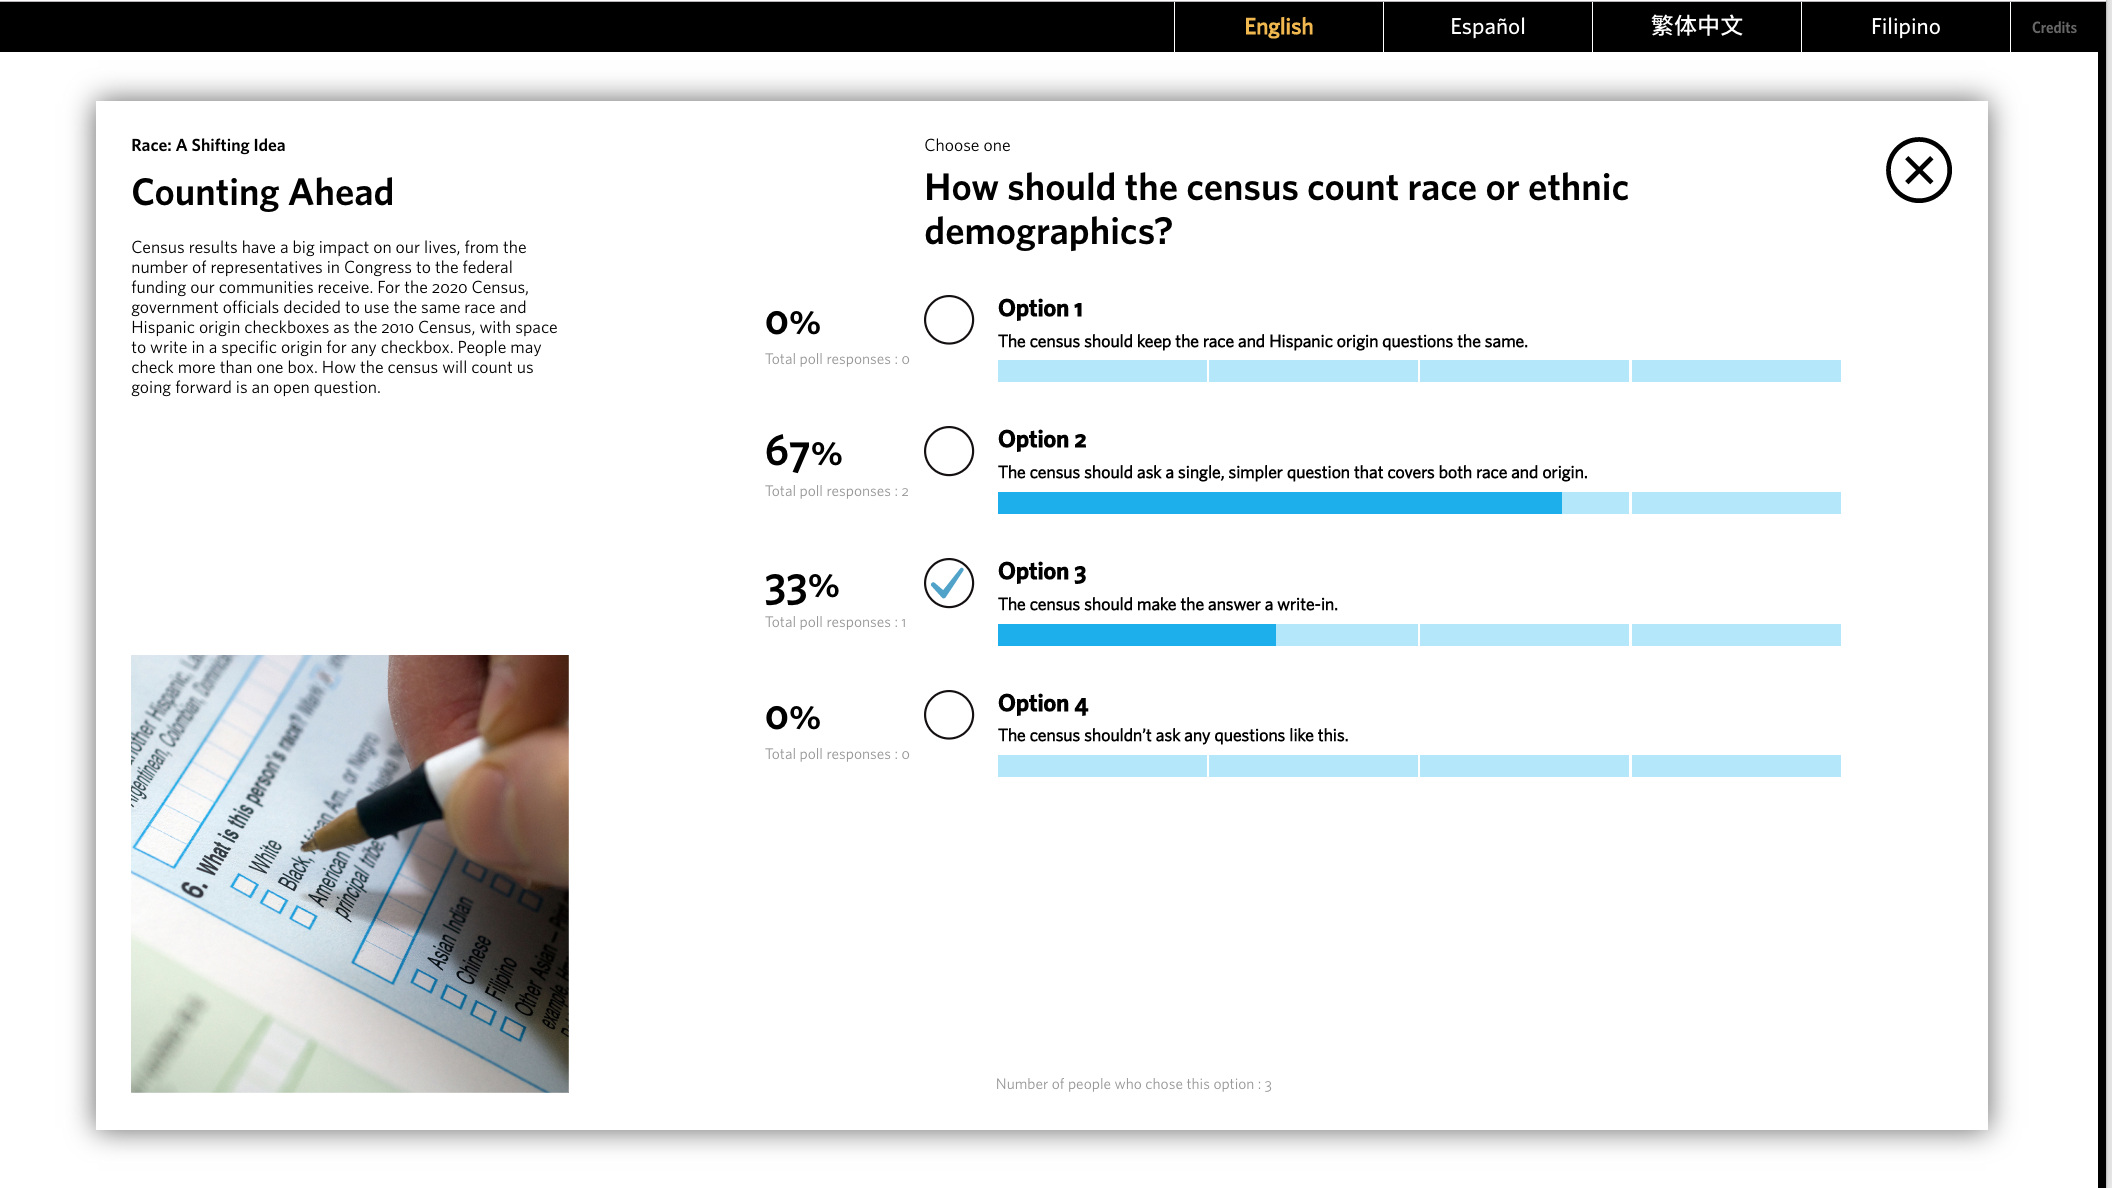
Results tallied from all participation from visitors. A way to participate with content that is very personal.
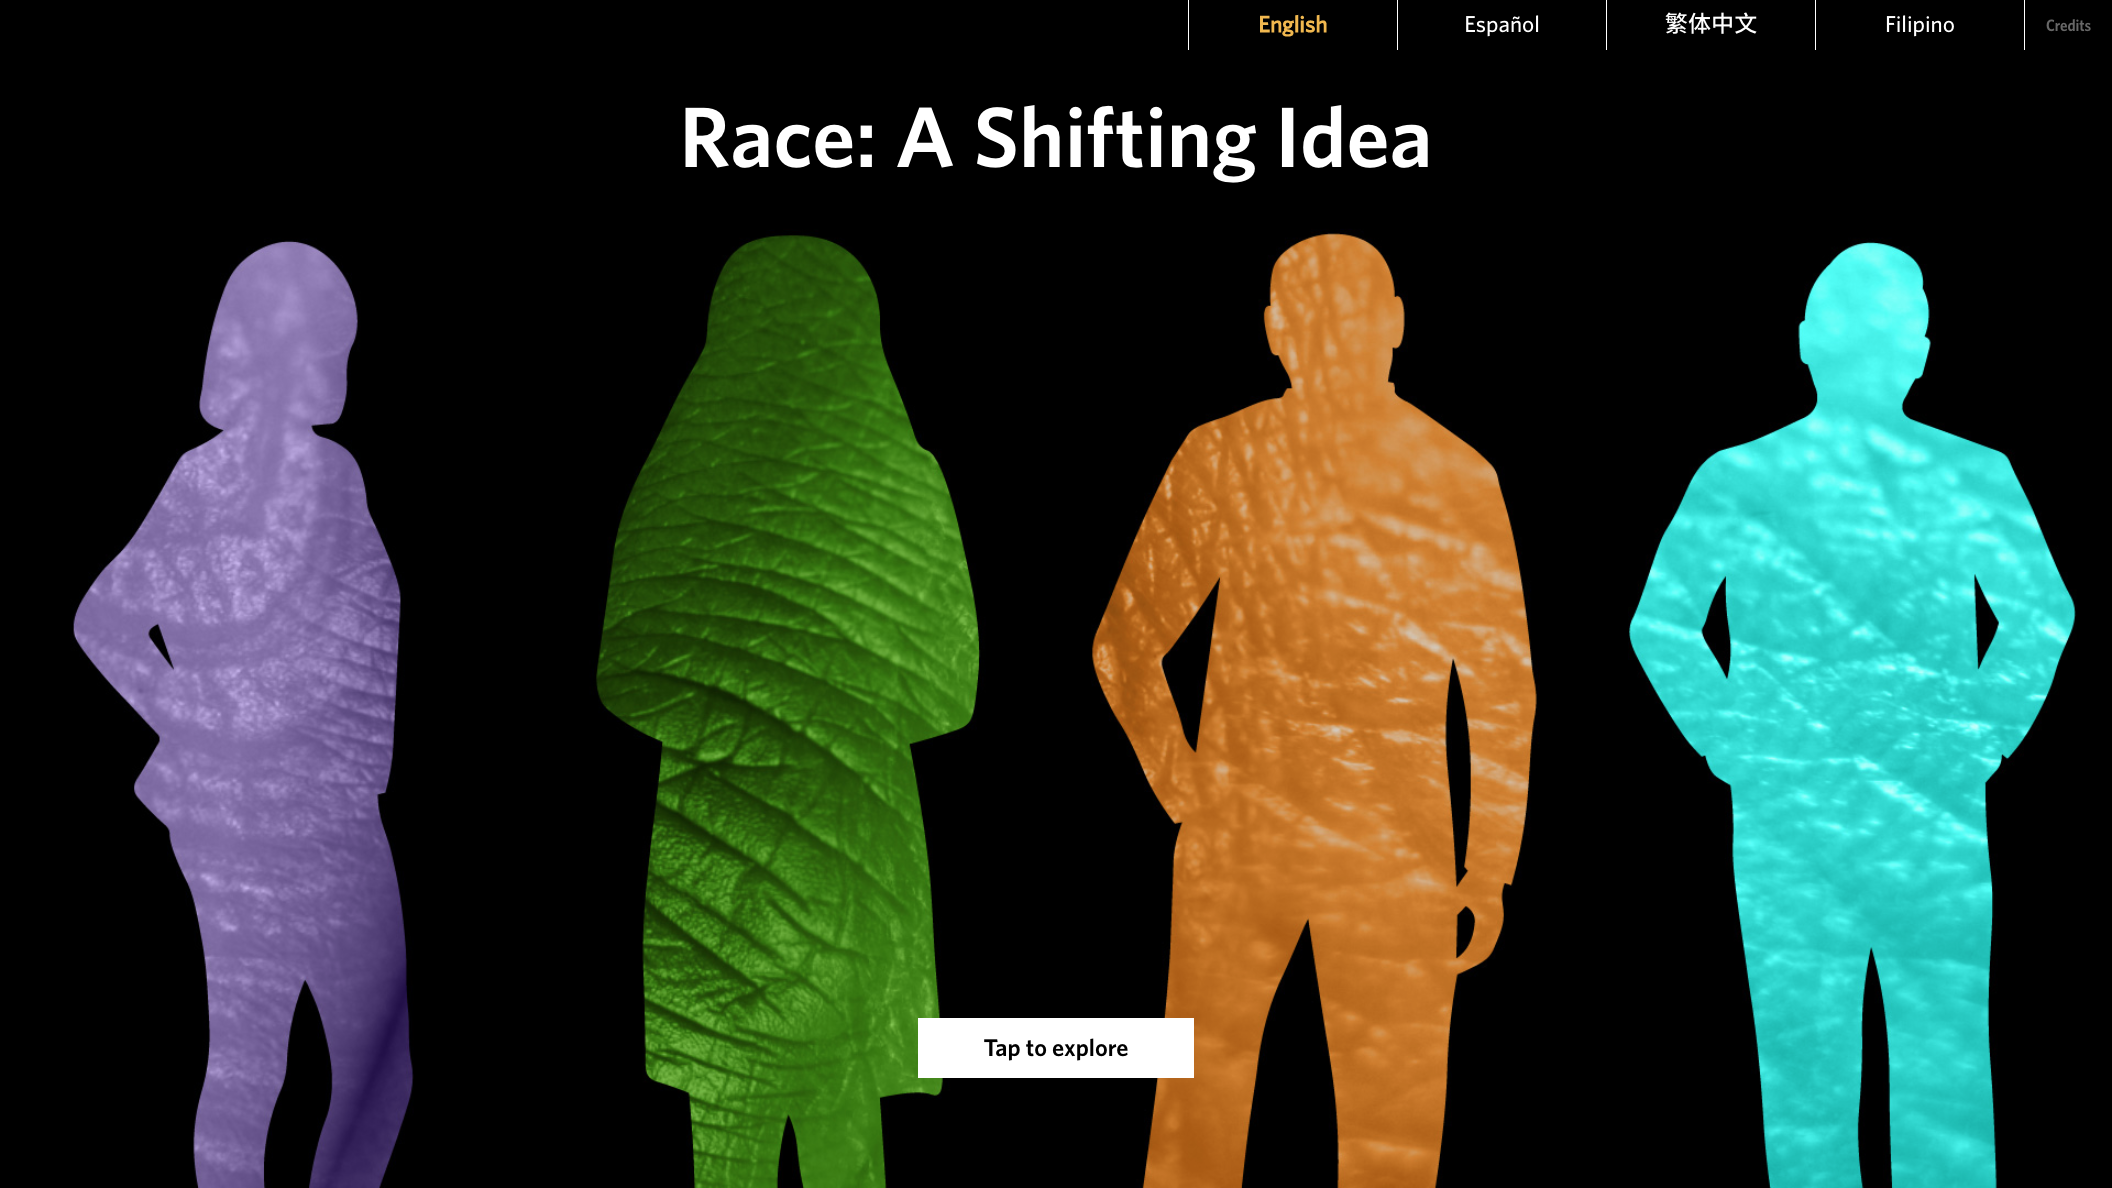
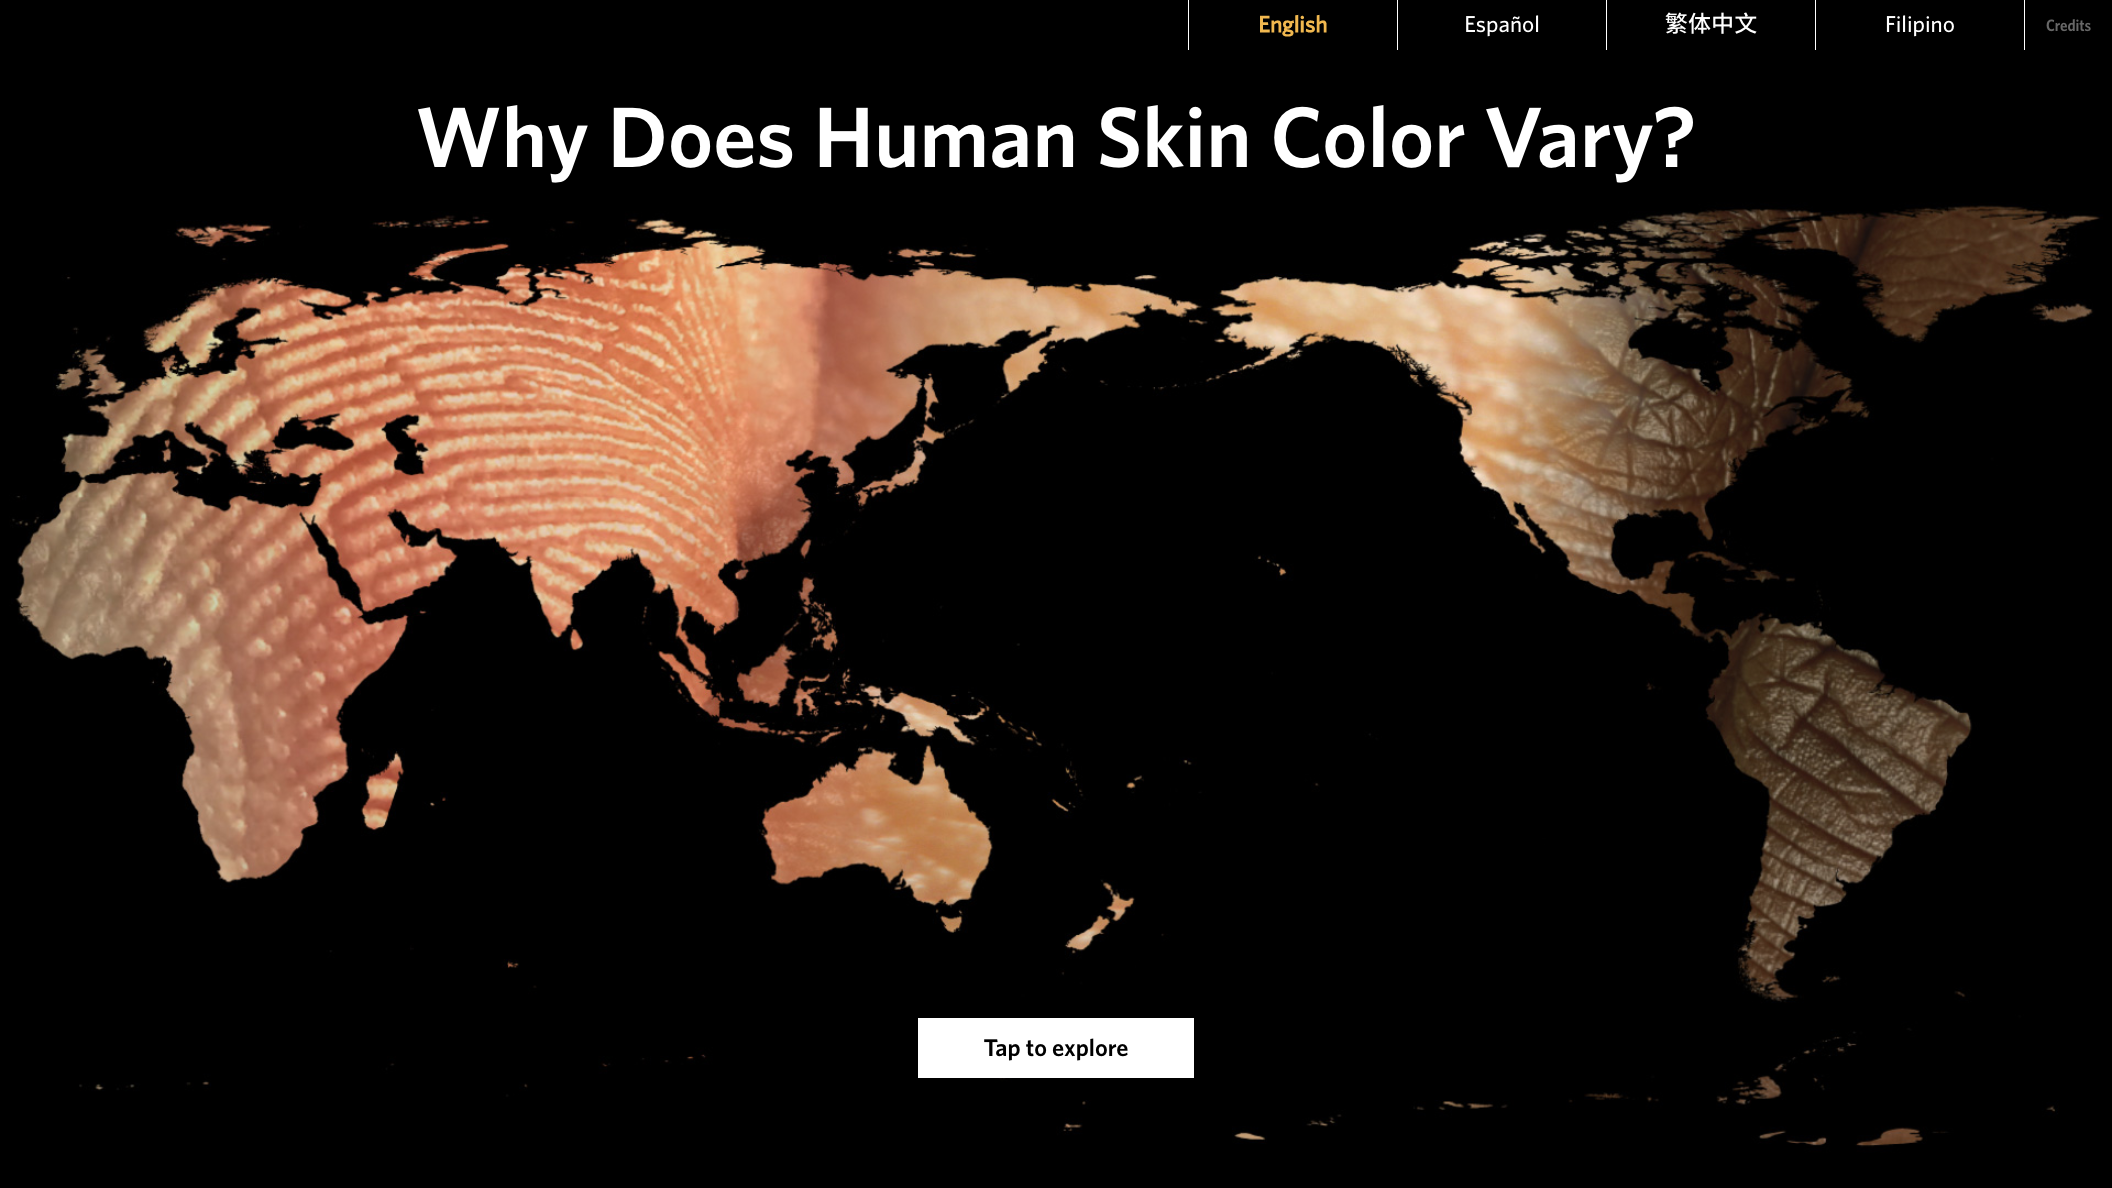
Animated attract screen

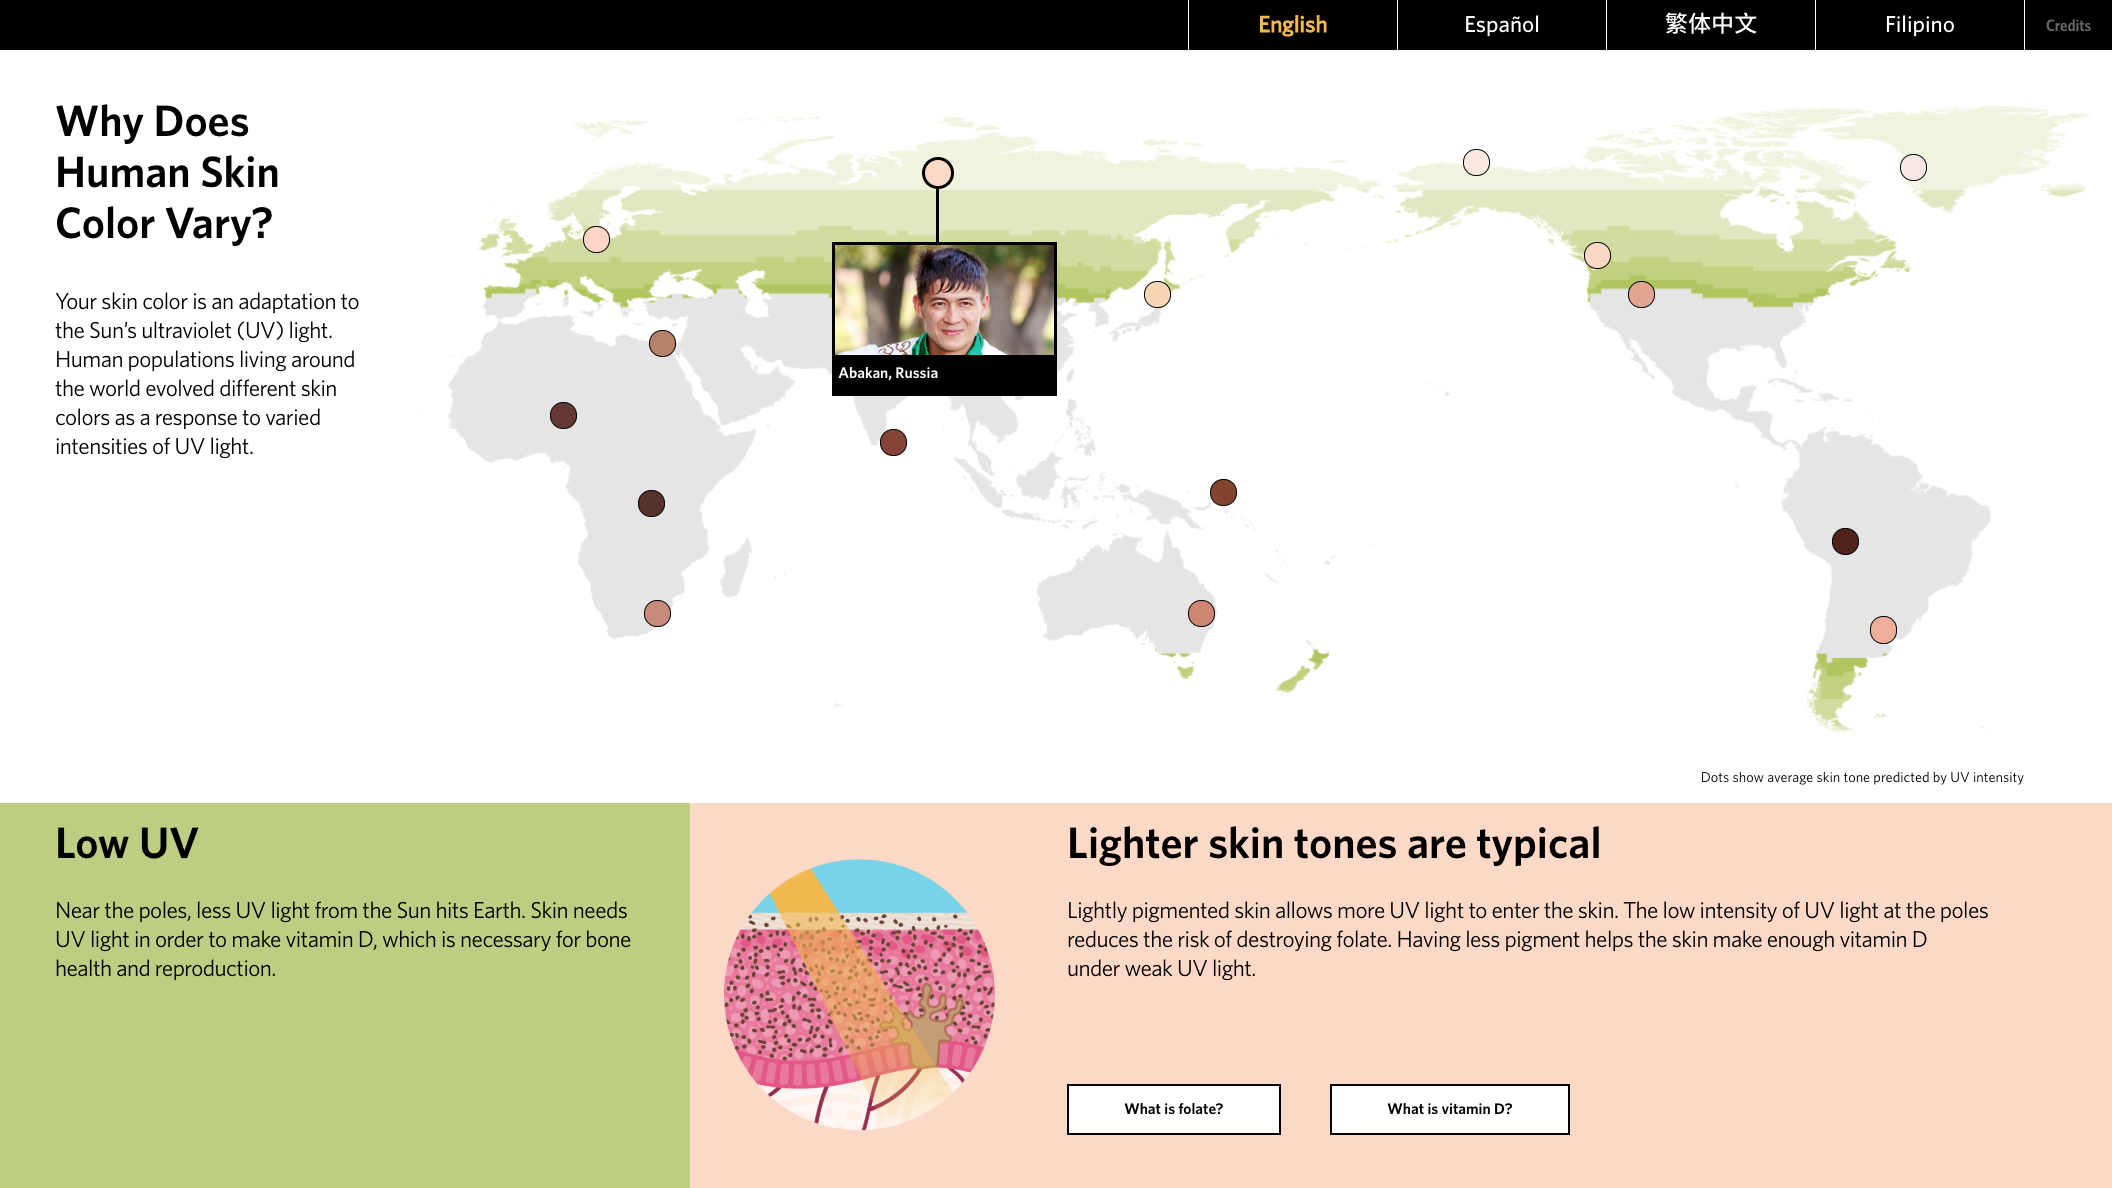
UV world map shows visitors similarities between native people from the same UV exposure zone. focused on changes in melanin, folate and Vitamin D. The included video is by the scientist whose UV maps are used in the interactive. The close-up skin Illustrations and animations included match graphics used across the exhibit.

Home screen. Visitors selected hotspots on the map to explore individuals from around the world in different UV zones
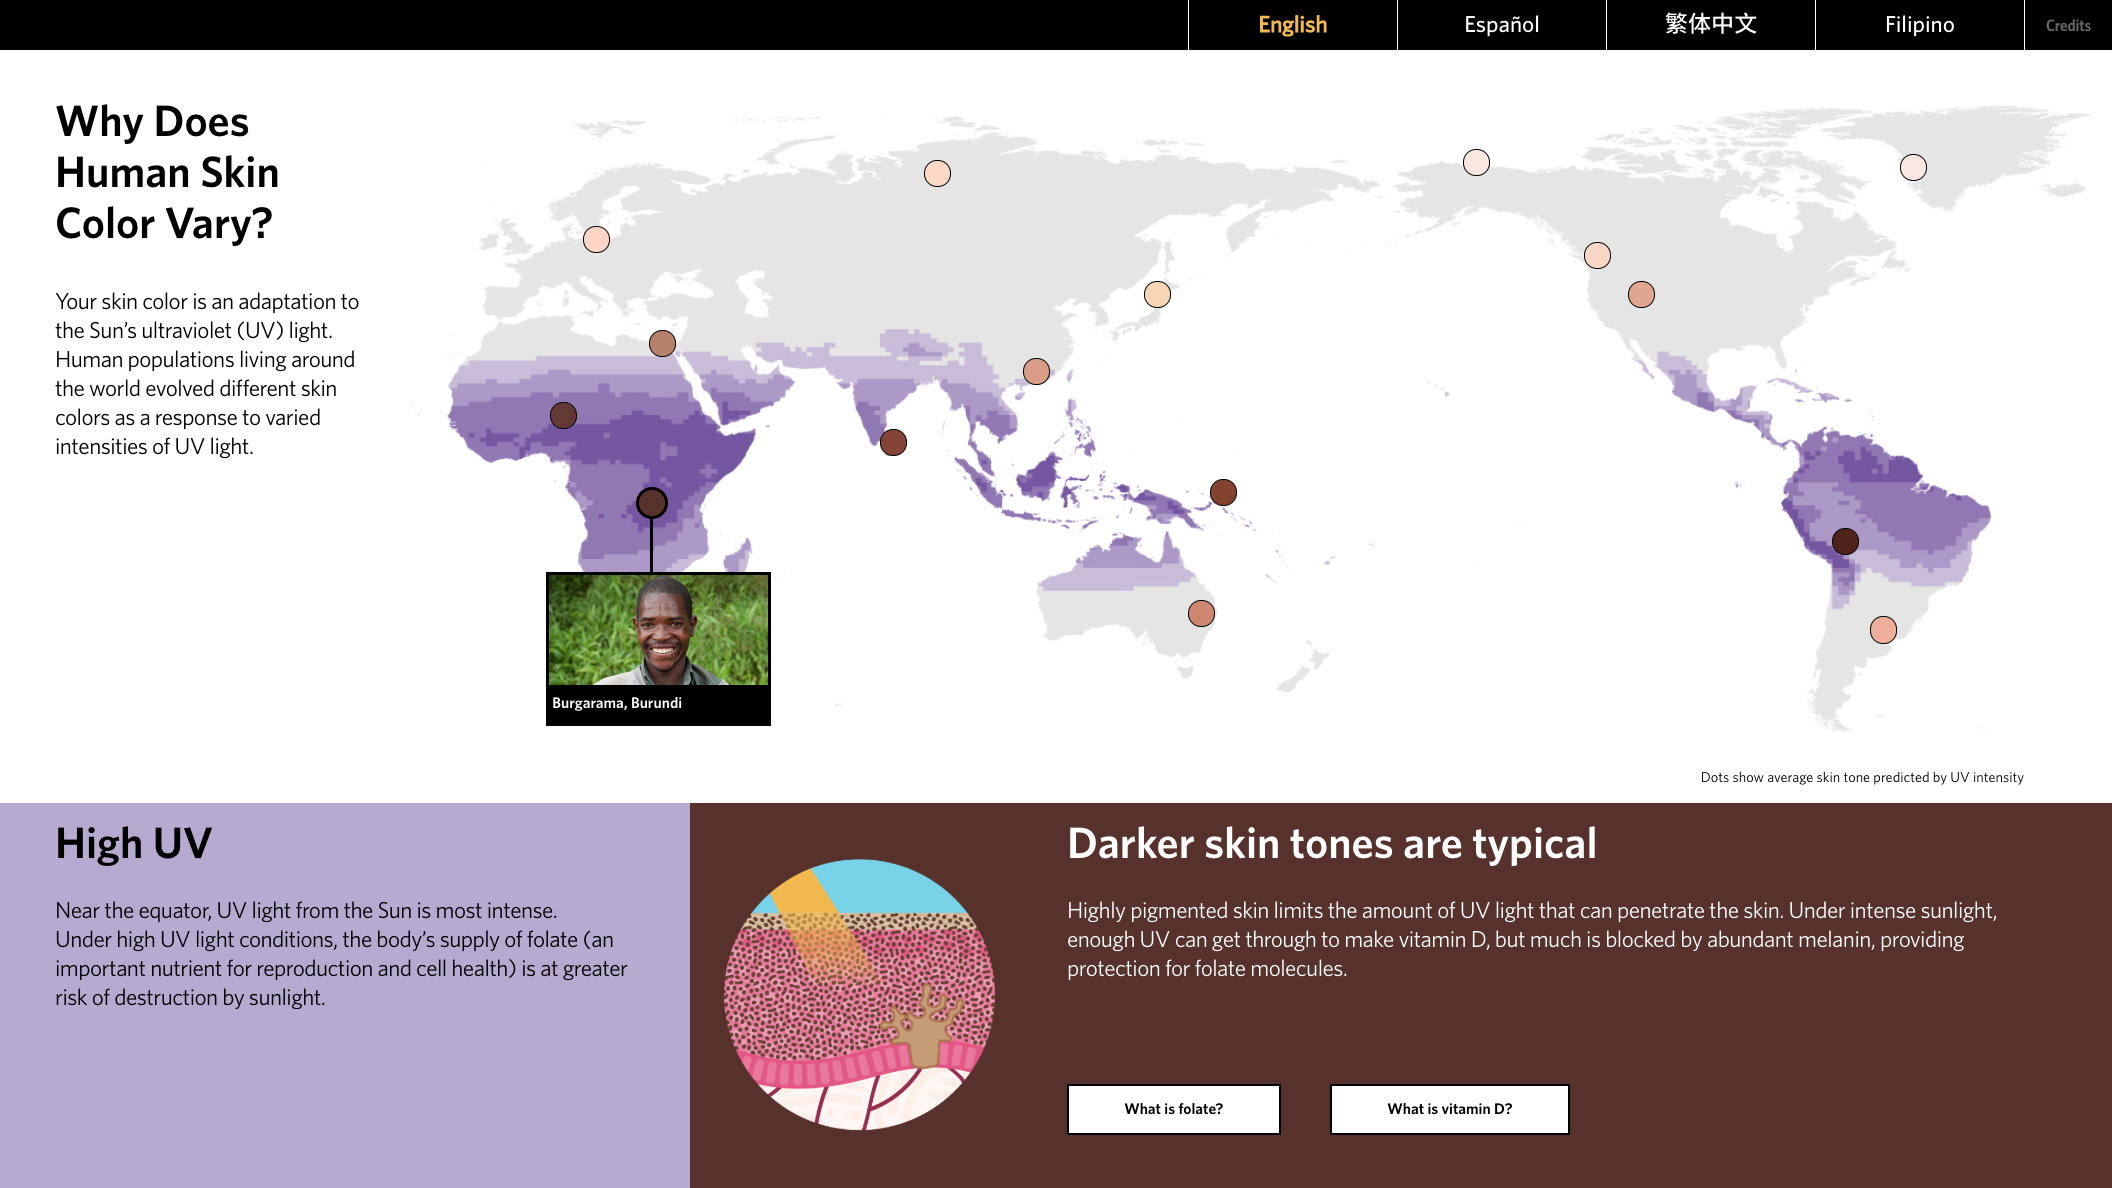
High UV example. Map, skin illustration, and content specific to each individual person.

High UV example. Map, skin illustration, and content specific to each individual person.

Mid UV example. Map, skin illustration, and content specific to each individual person.

High UV example. Map, skin illustration, and content specific to each individual person.

Low UV example. Map, skin illustration, and content specific to each individual person.
High UV example. Map, skin illustration, and content specific to each individual person.

Pop up content about folate accessed by the buttons
Attract animation. Using skin photos as a collage aligned with the exhibit branding.

Installation of the screen and the graphics surrounding the interactive. with dynamic photo and video collage wall.

Installation of the screen and the graphics surrounding the interactive.
The Team
Andrew Sawyer – Visual Design & UX
Sarah Goodin – Content
James Davidson – Animation & Illustration
Josh Ause – Web Development
Kat Whitney – Photography
Kira Hammond – Video Production