
3 Systems
California Academy of Sciences,
San Francisco
2018
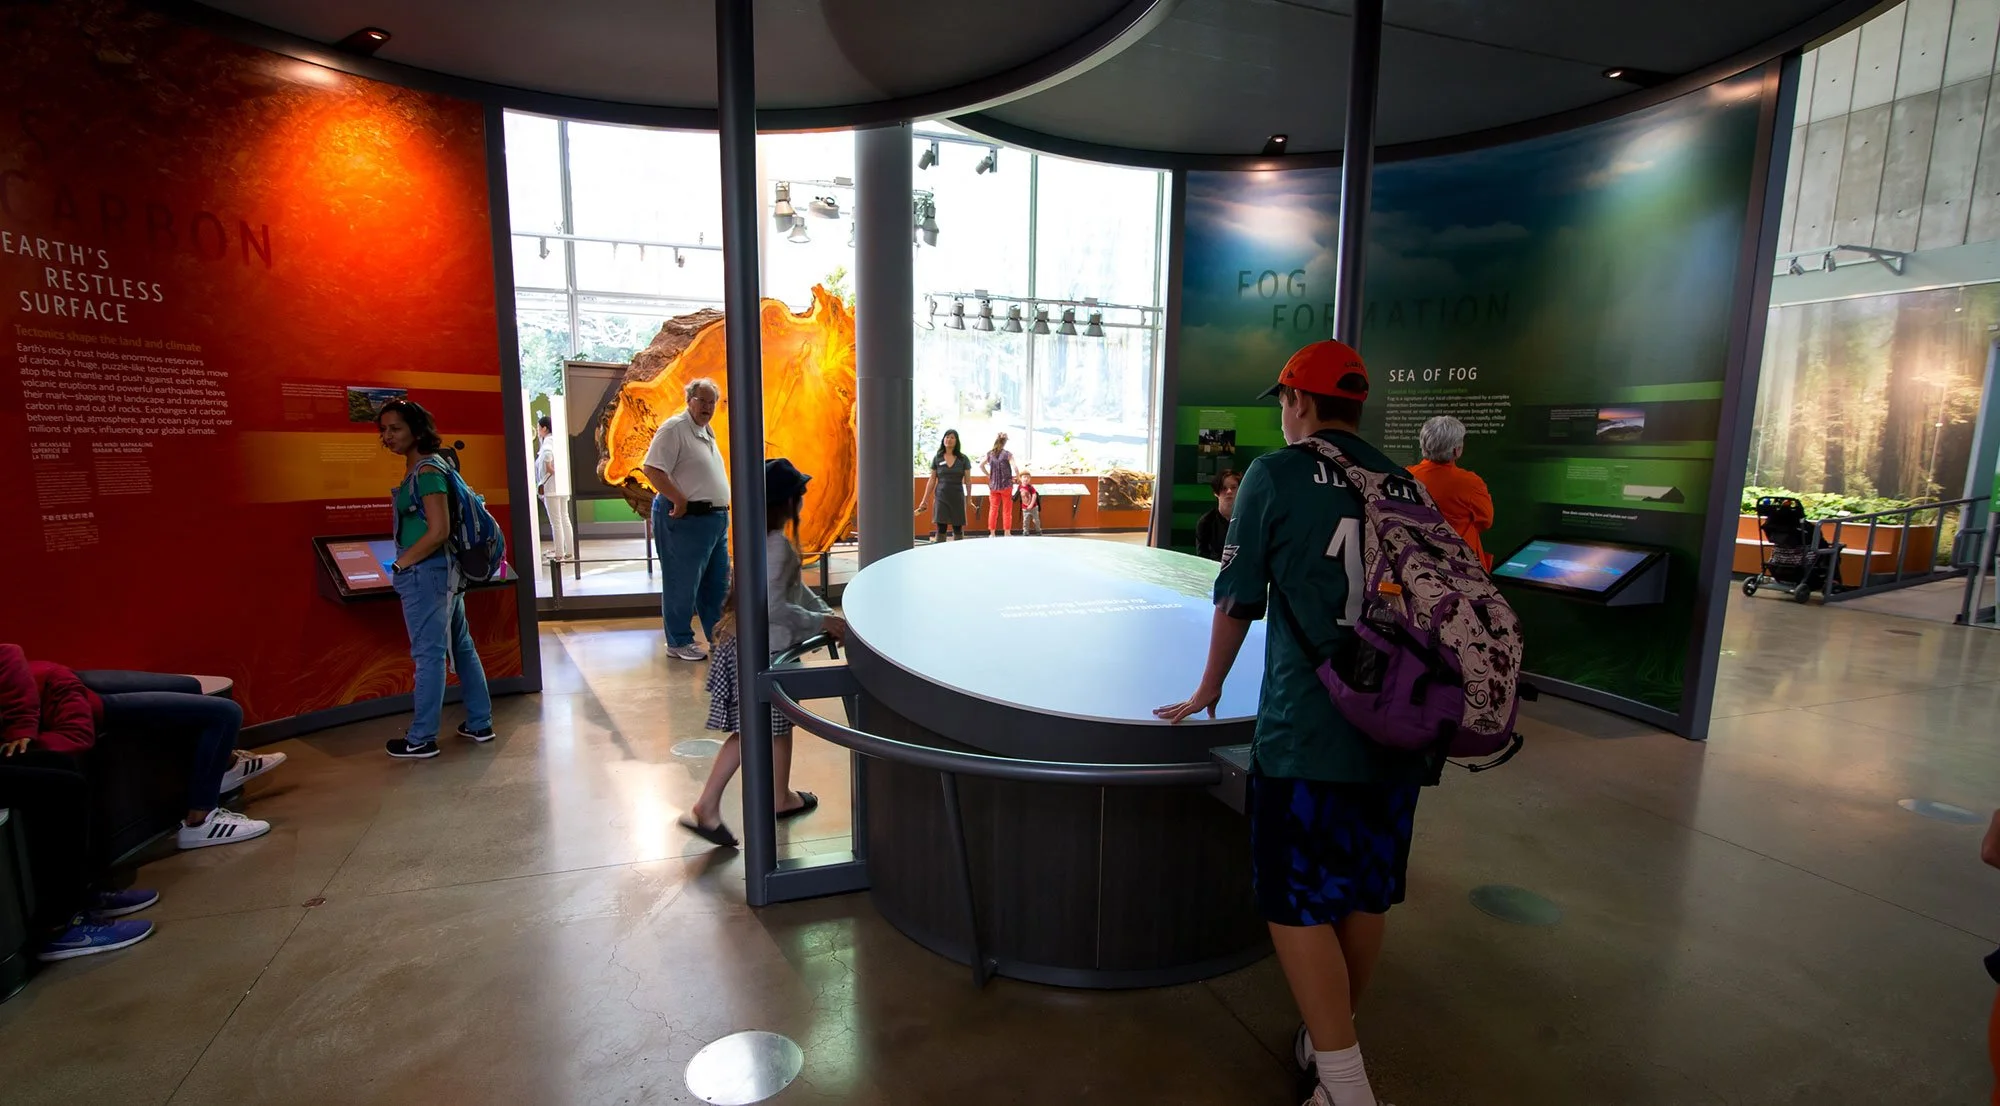
Venn diagram shaped structure housing a trio of touchscreens with an interactive map at the center. The three systems show in detail are Carbon Cycle, Ocean Upwelling, and Coastal Fog.
Touchscreen to learn more about systems. Each interface uses an illustrated landmass overlayed with sticker like buttons which trigger animations and storytelling describing the factors and impacts of these systems. Ocean Upwelling animation shown as an example.
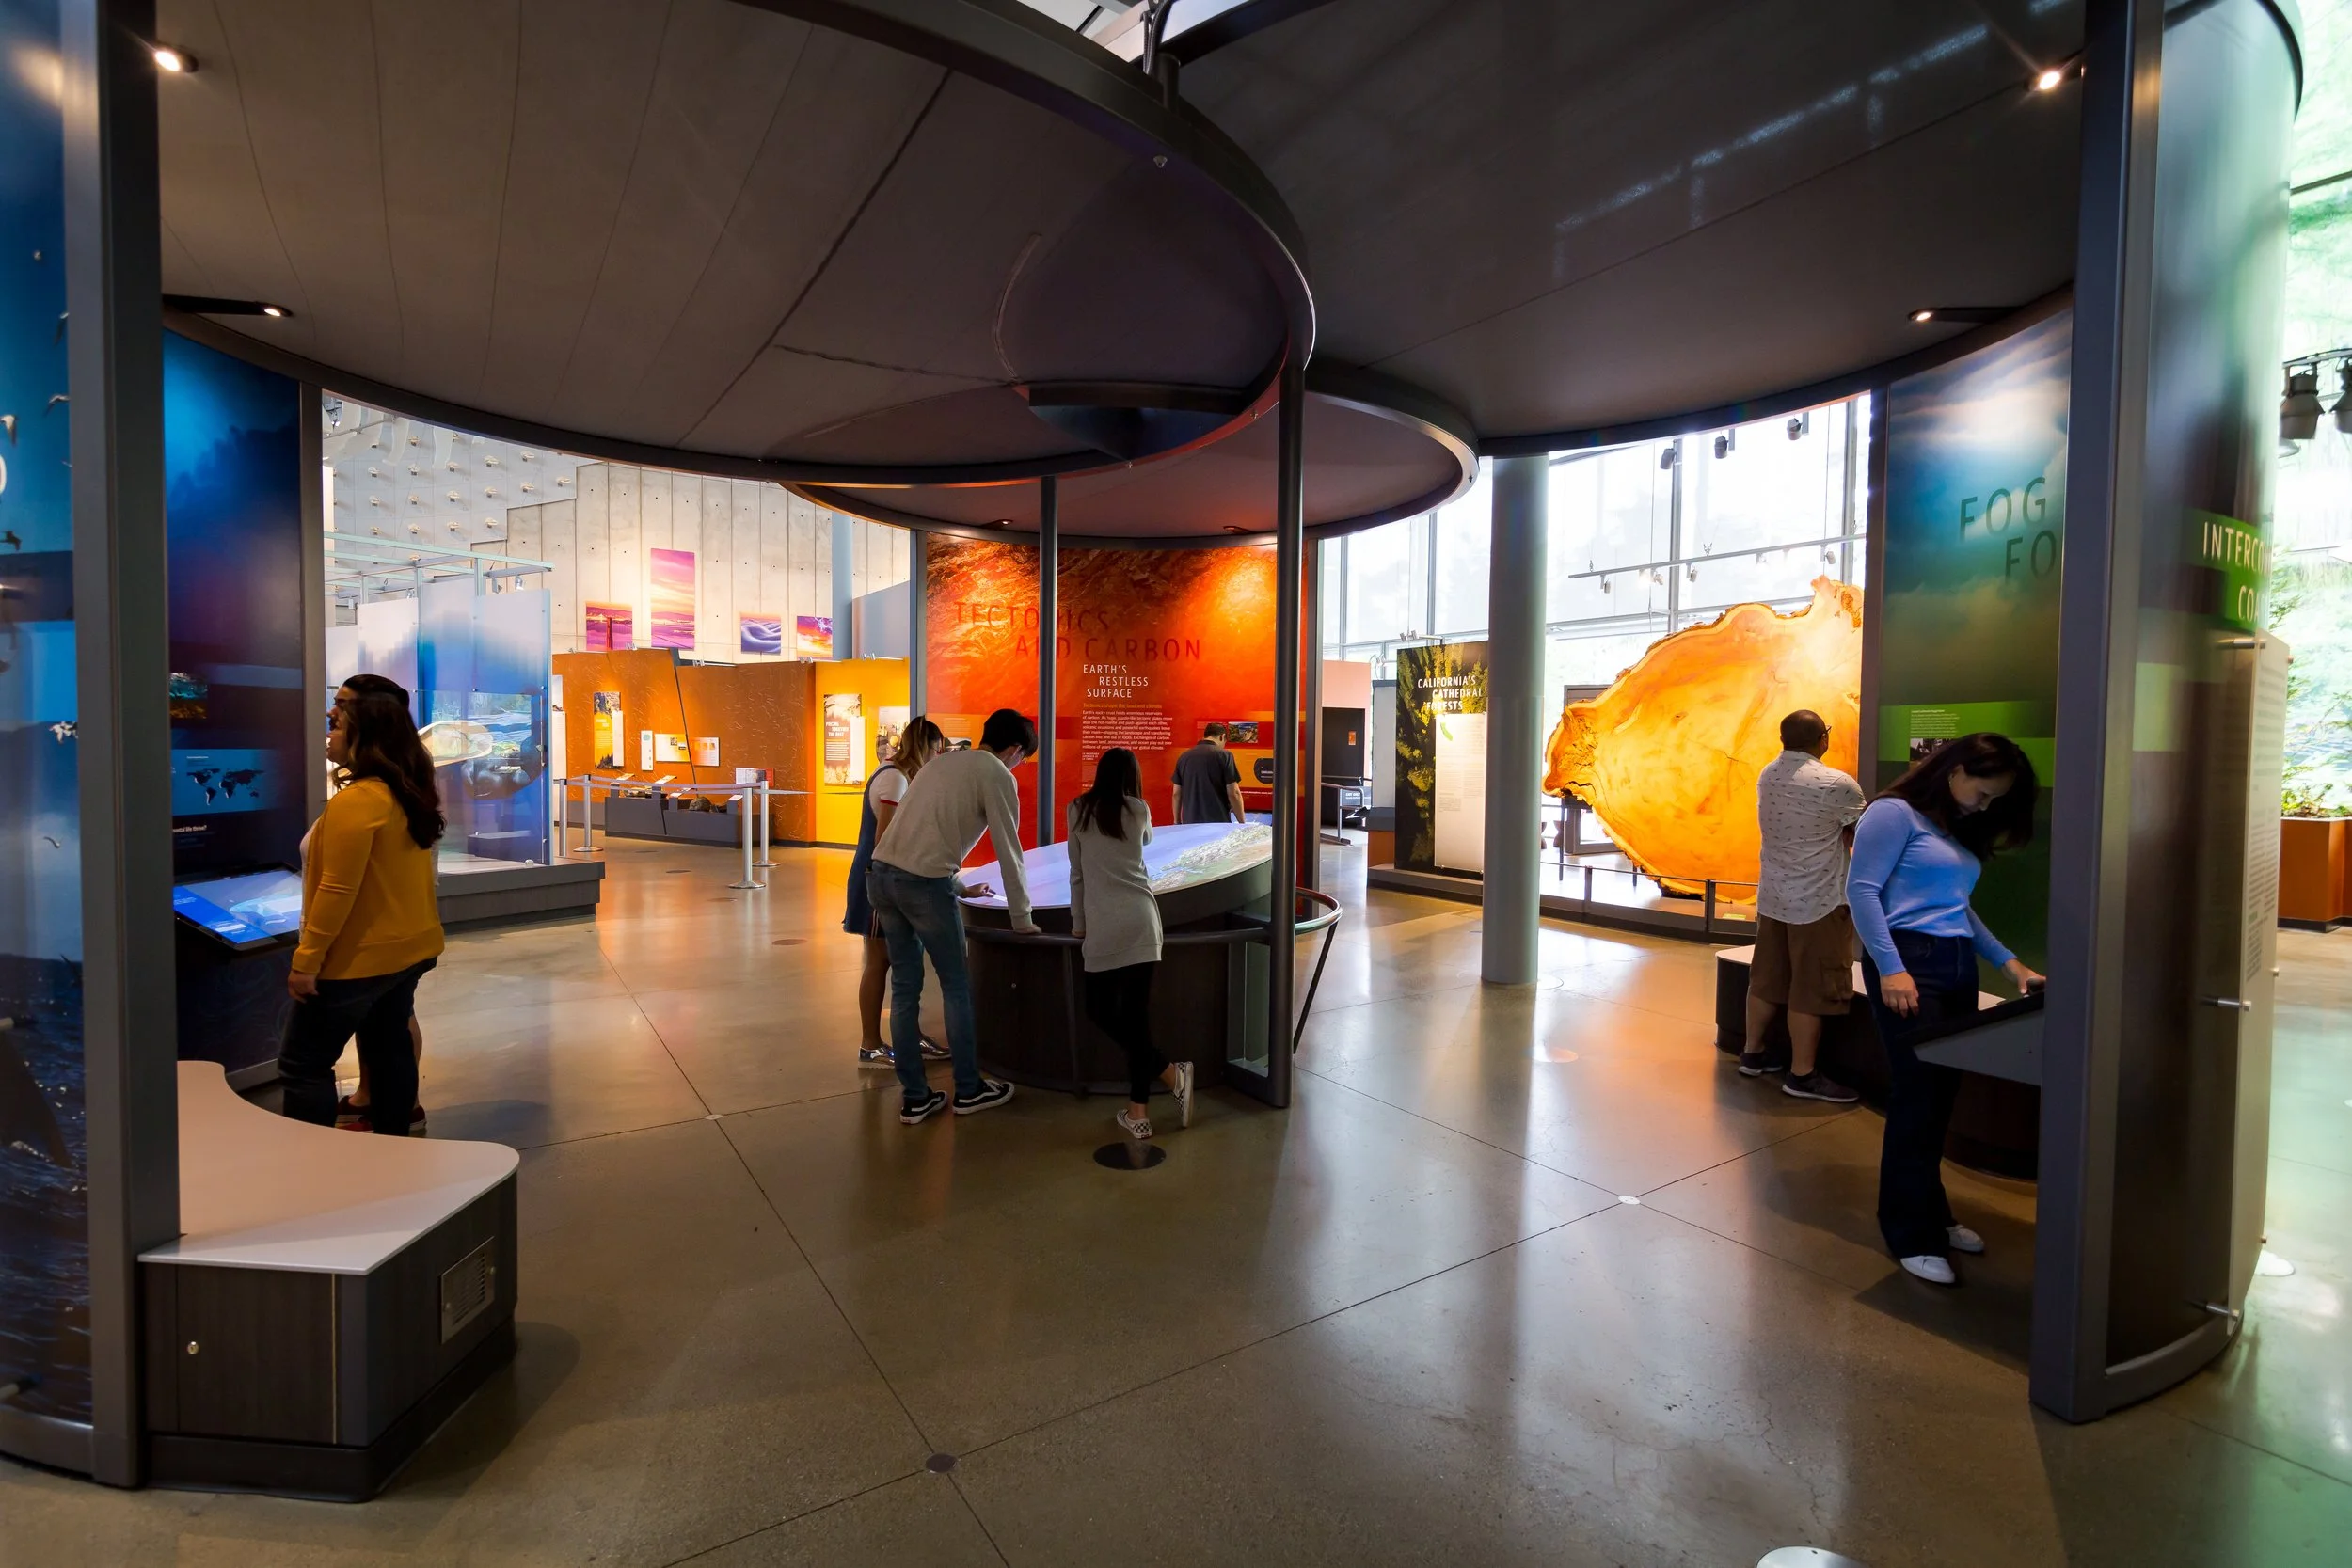
Installation of the screen and the graphics surrounding the interactive inside of a venn diagram shaped structure.

At the center of the structure was a projection mapped round screen that had video storytelling highlighting aspects of the California topographic map.
Clickthrough of the Carbon Exchange touchscreen as part of 3 Systems to show the UX and animations

By clicking different hotspots (next to illustrations and parts of the landmass), pop up content and animations are triggered.

The looping animation shows how carbon changes state and enters the atmosphere and oceans from a volcano.

The looping animation shows the San Andreas Fault line for earthquakes.
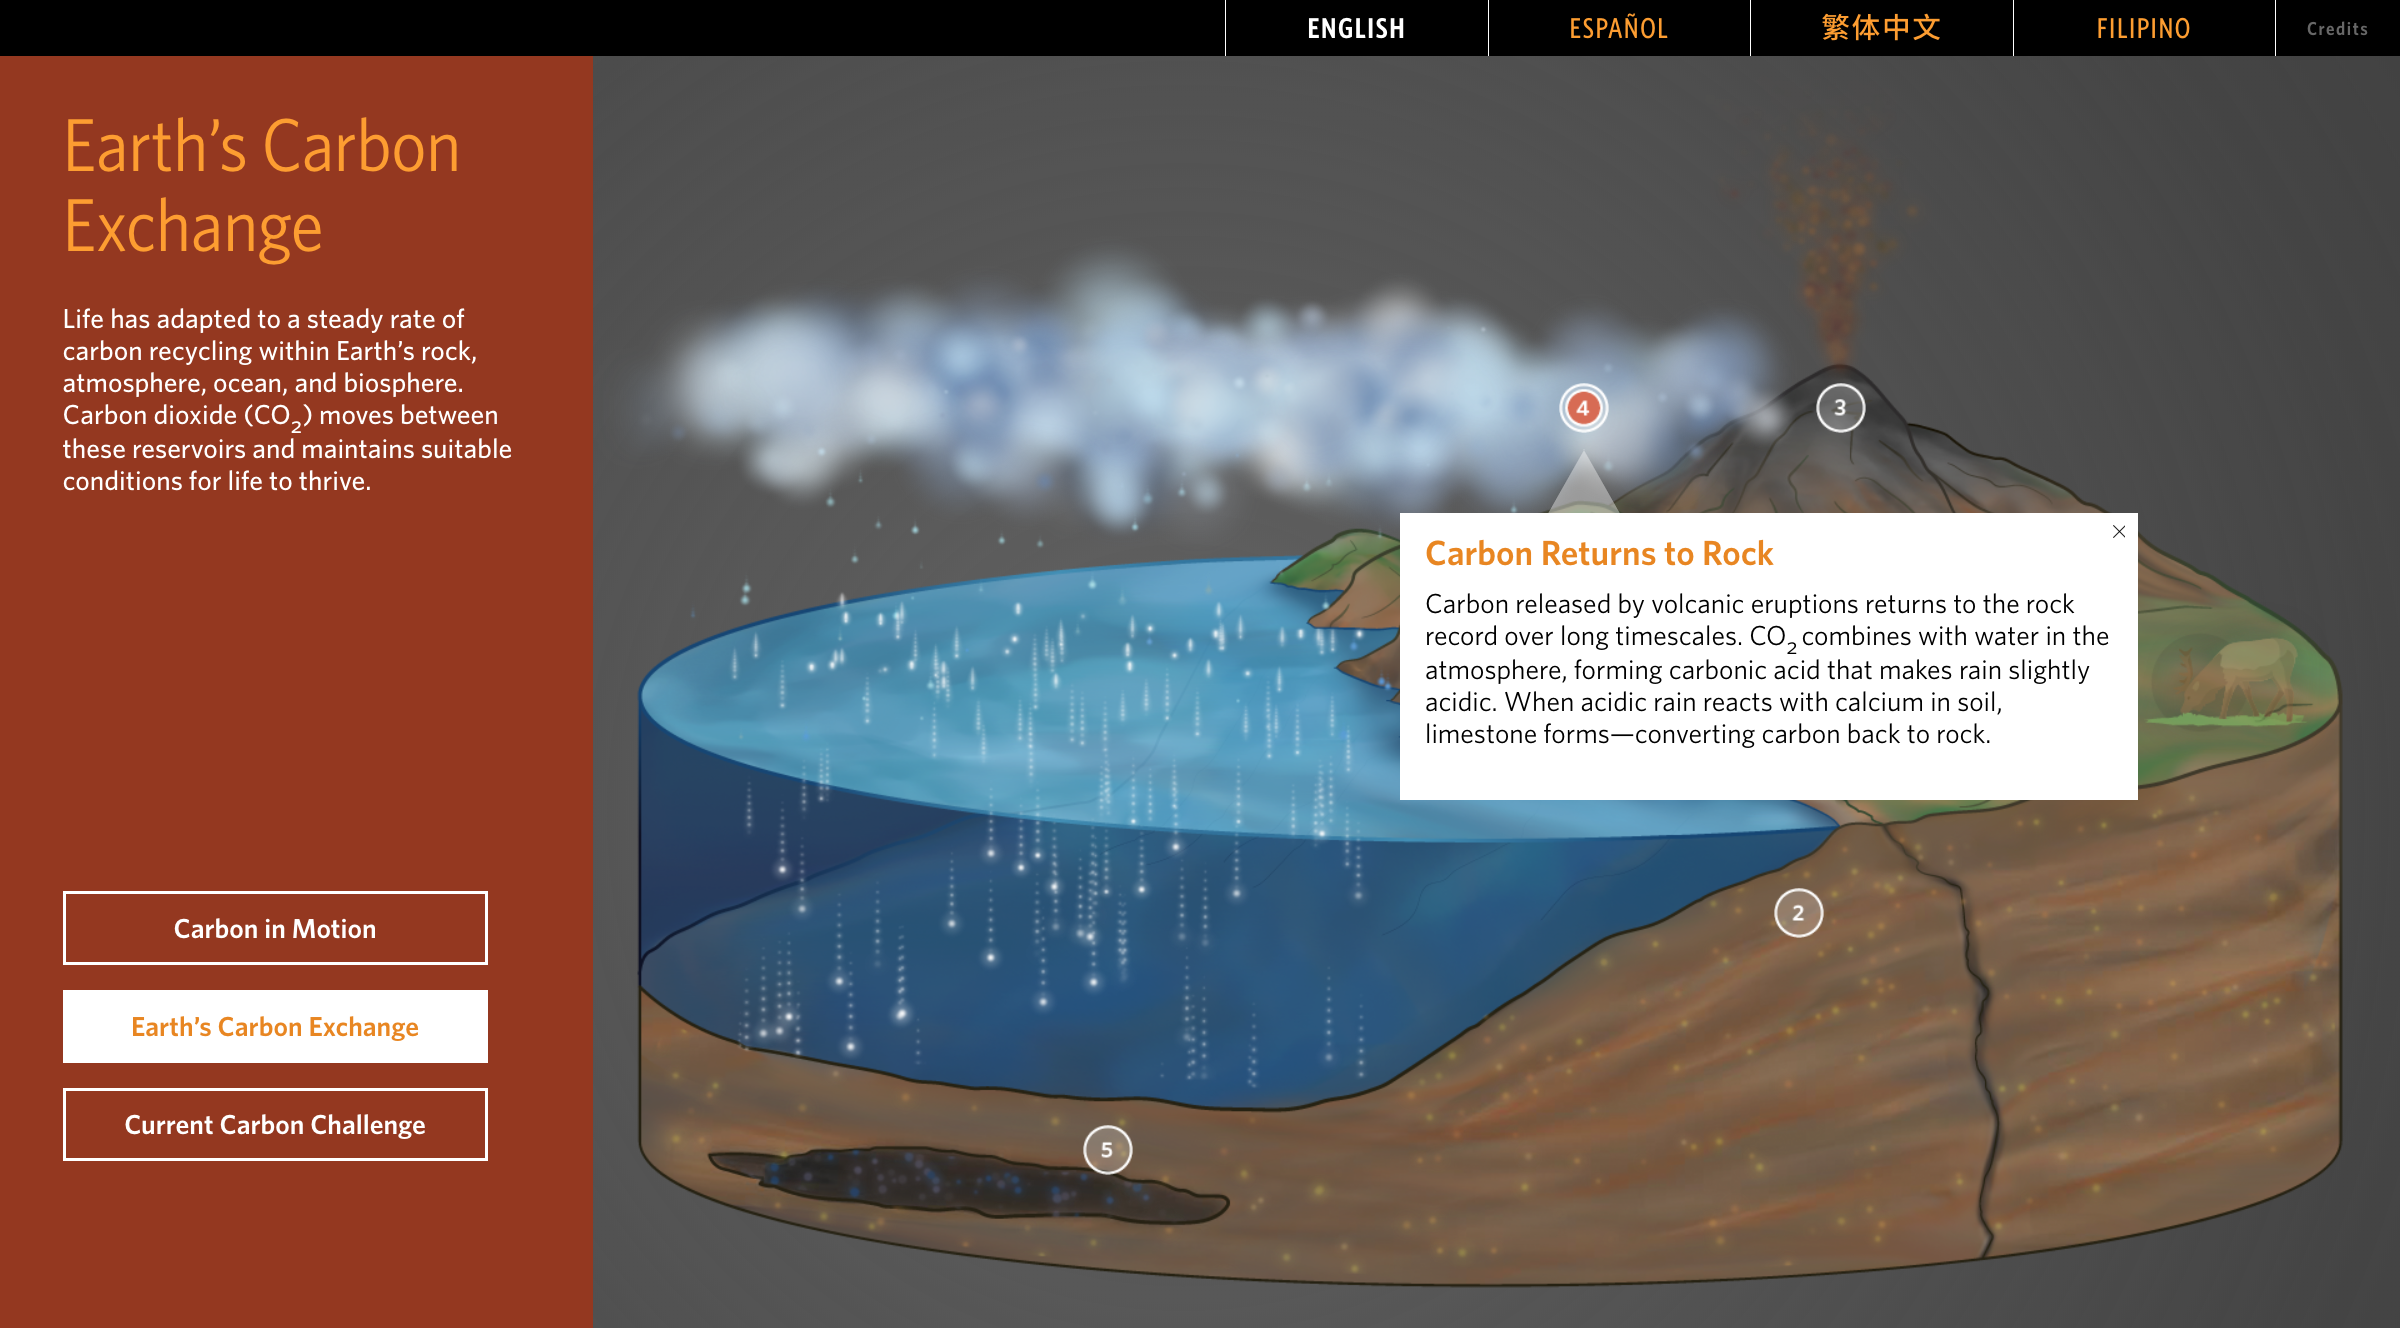
The looping animation shows how carbon returns to the rock through rain.

The looping animation was more subtle. It shows the carbon molecules changing while in the ground.

The looping animation shows oil reserves and the tides as they impact the carbon cycle.

This popup content is about the building of mollusk shells.
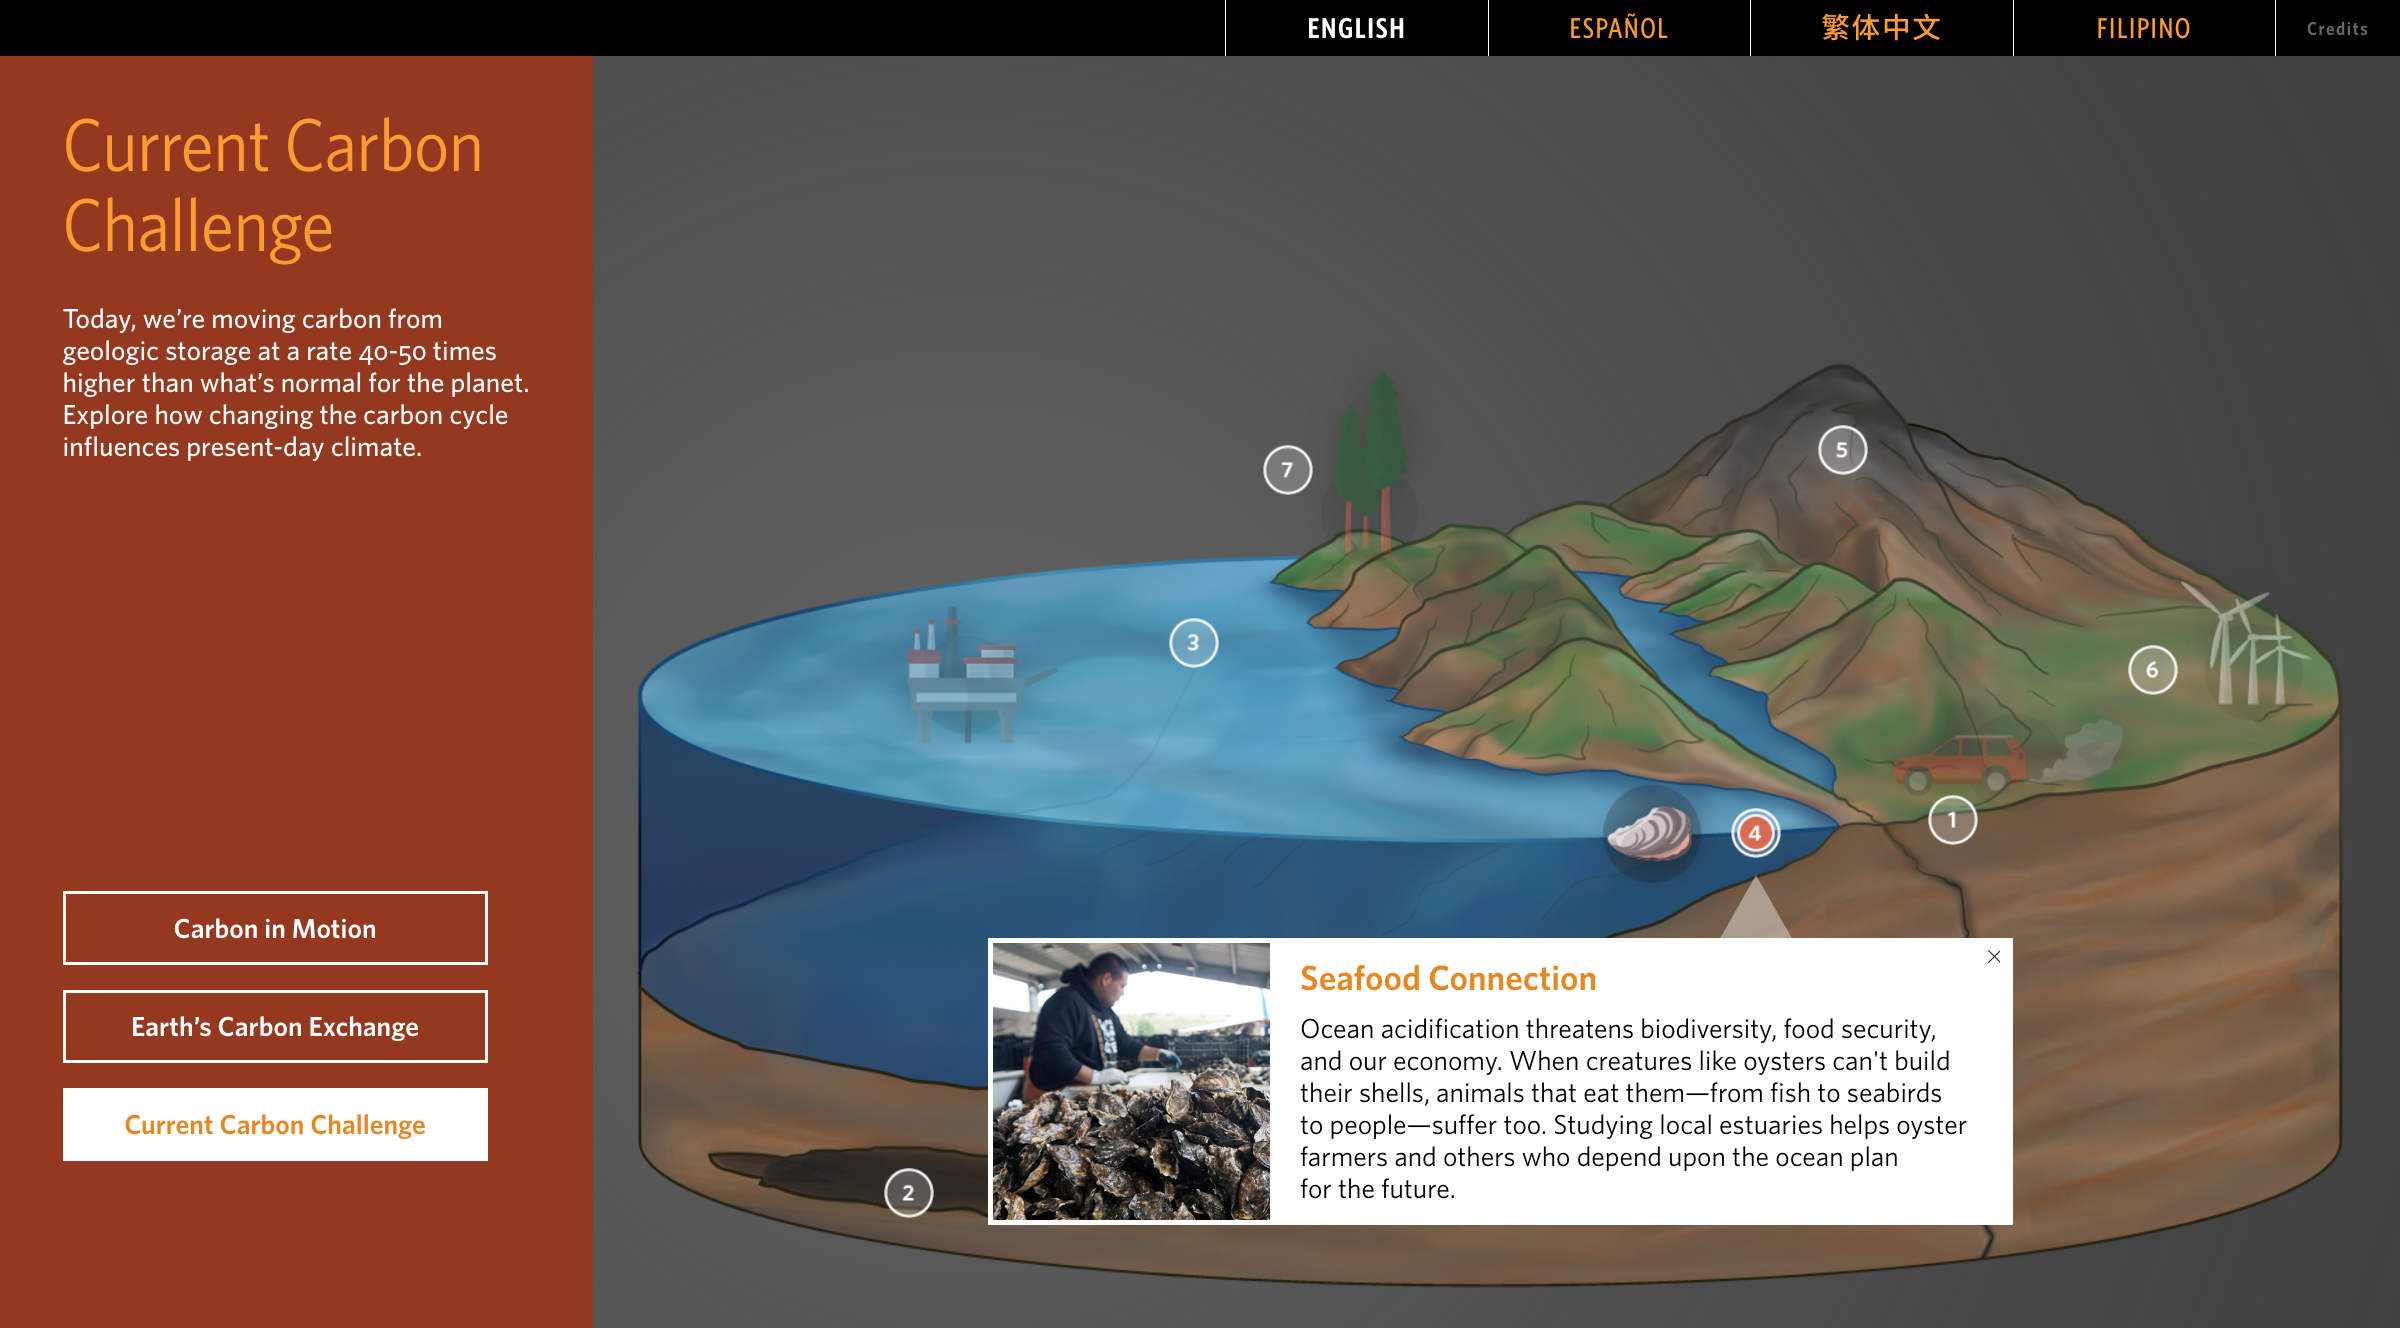
This popup content associated with the oyster illustration.
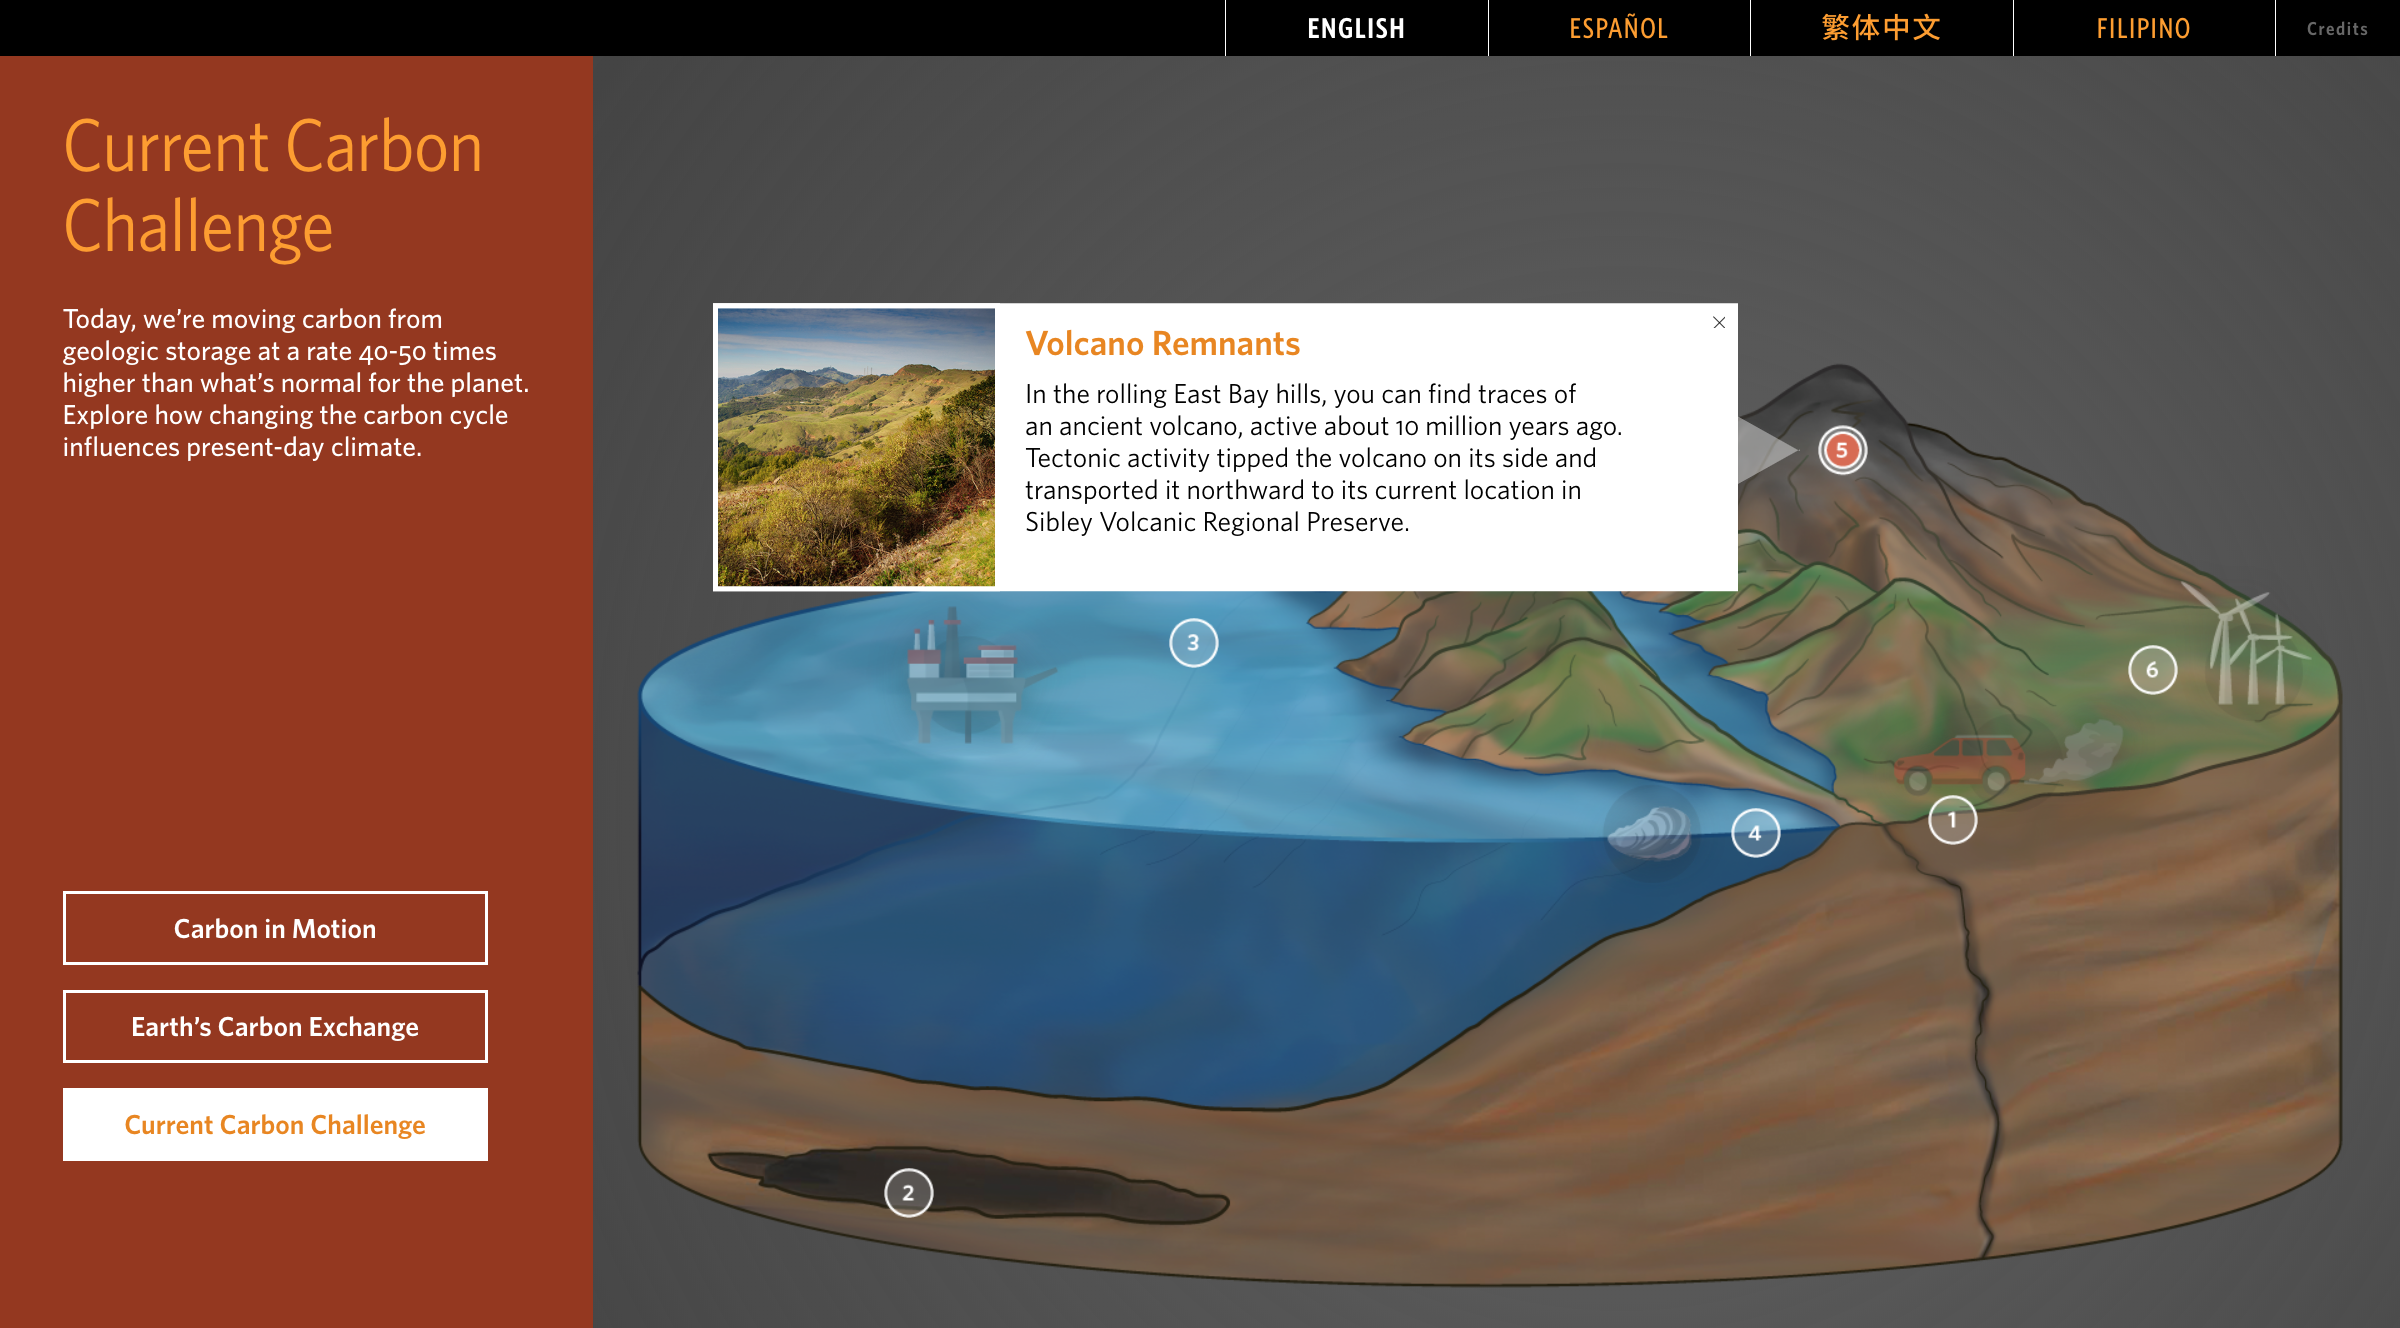
This popup content is about aging volcanos.
Clickthrough of the Fog Ingredients touchscreen as part of 3 Systems to show the UX and animations
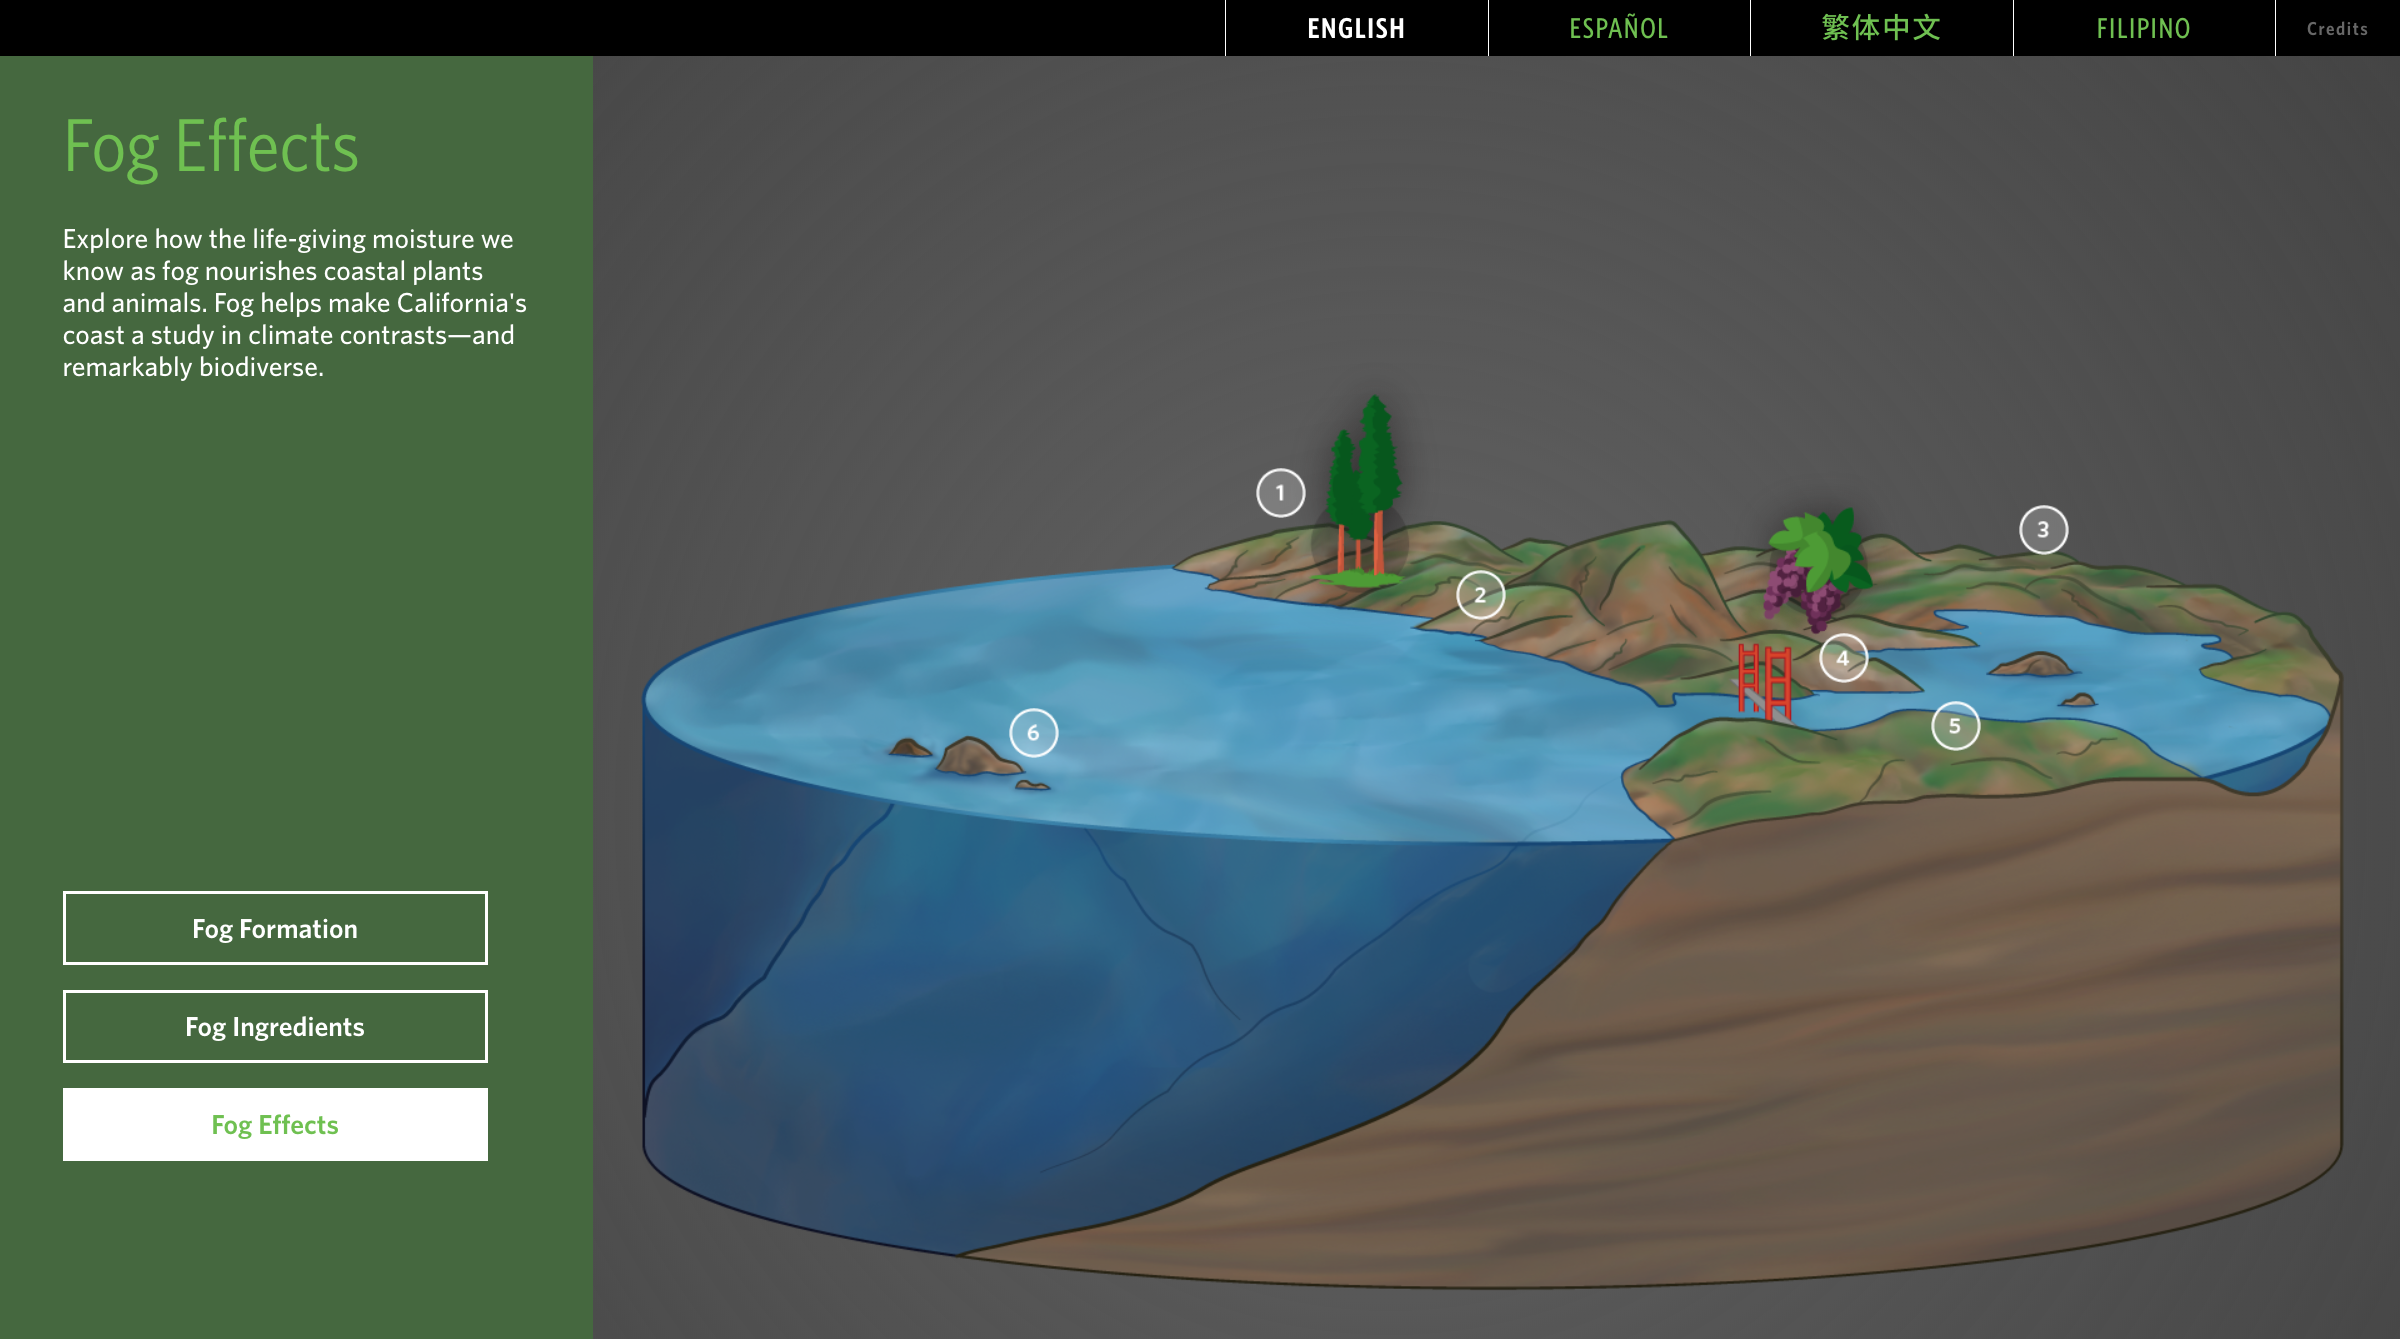
By clicking different hotspots (next to illustrations and parts of the landmass), pop up content and animations are triggered.
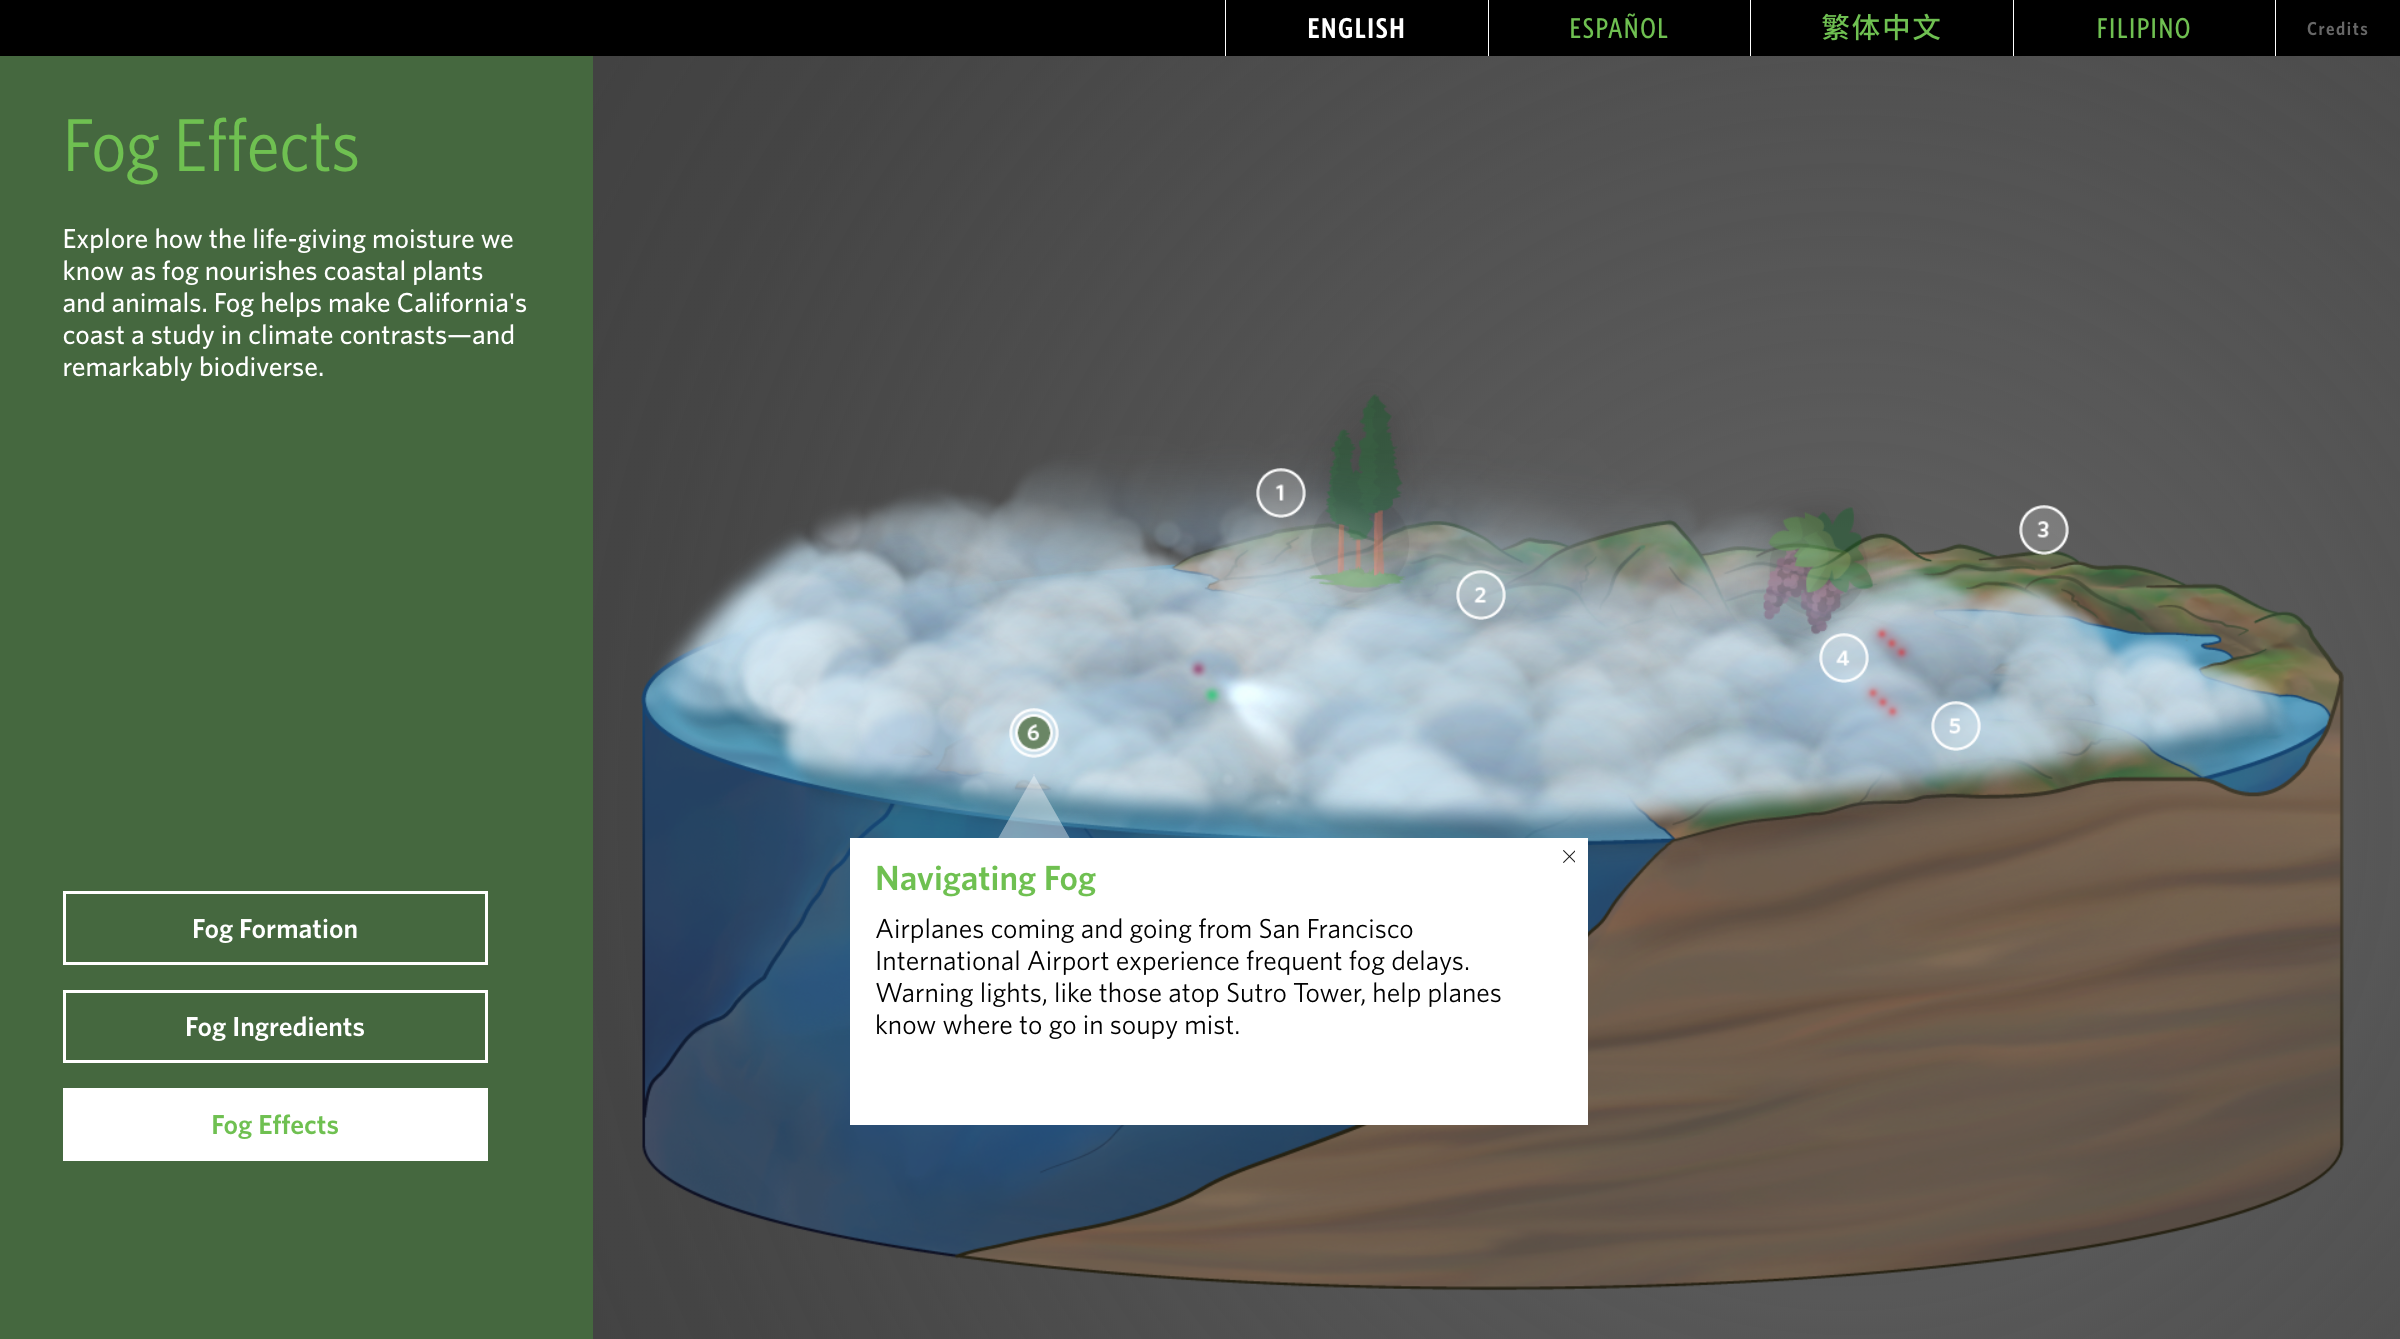
The fog animations cover and change the landmass. This animation shows a plane navigating through thick fog.
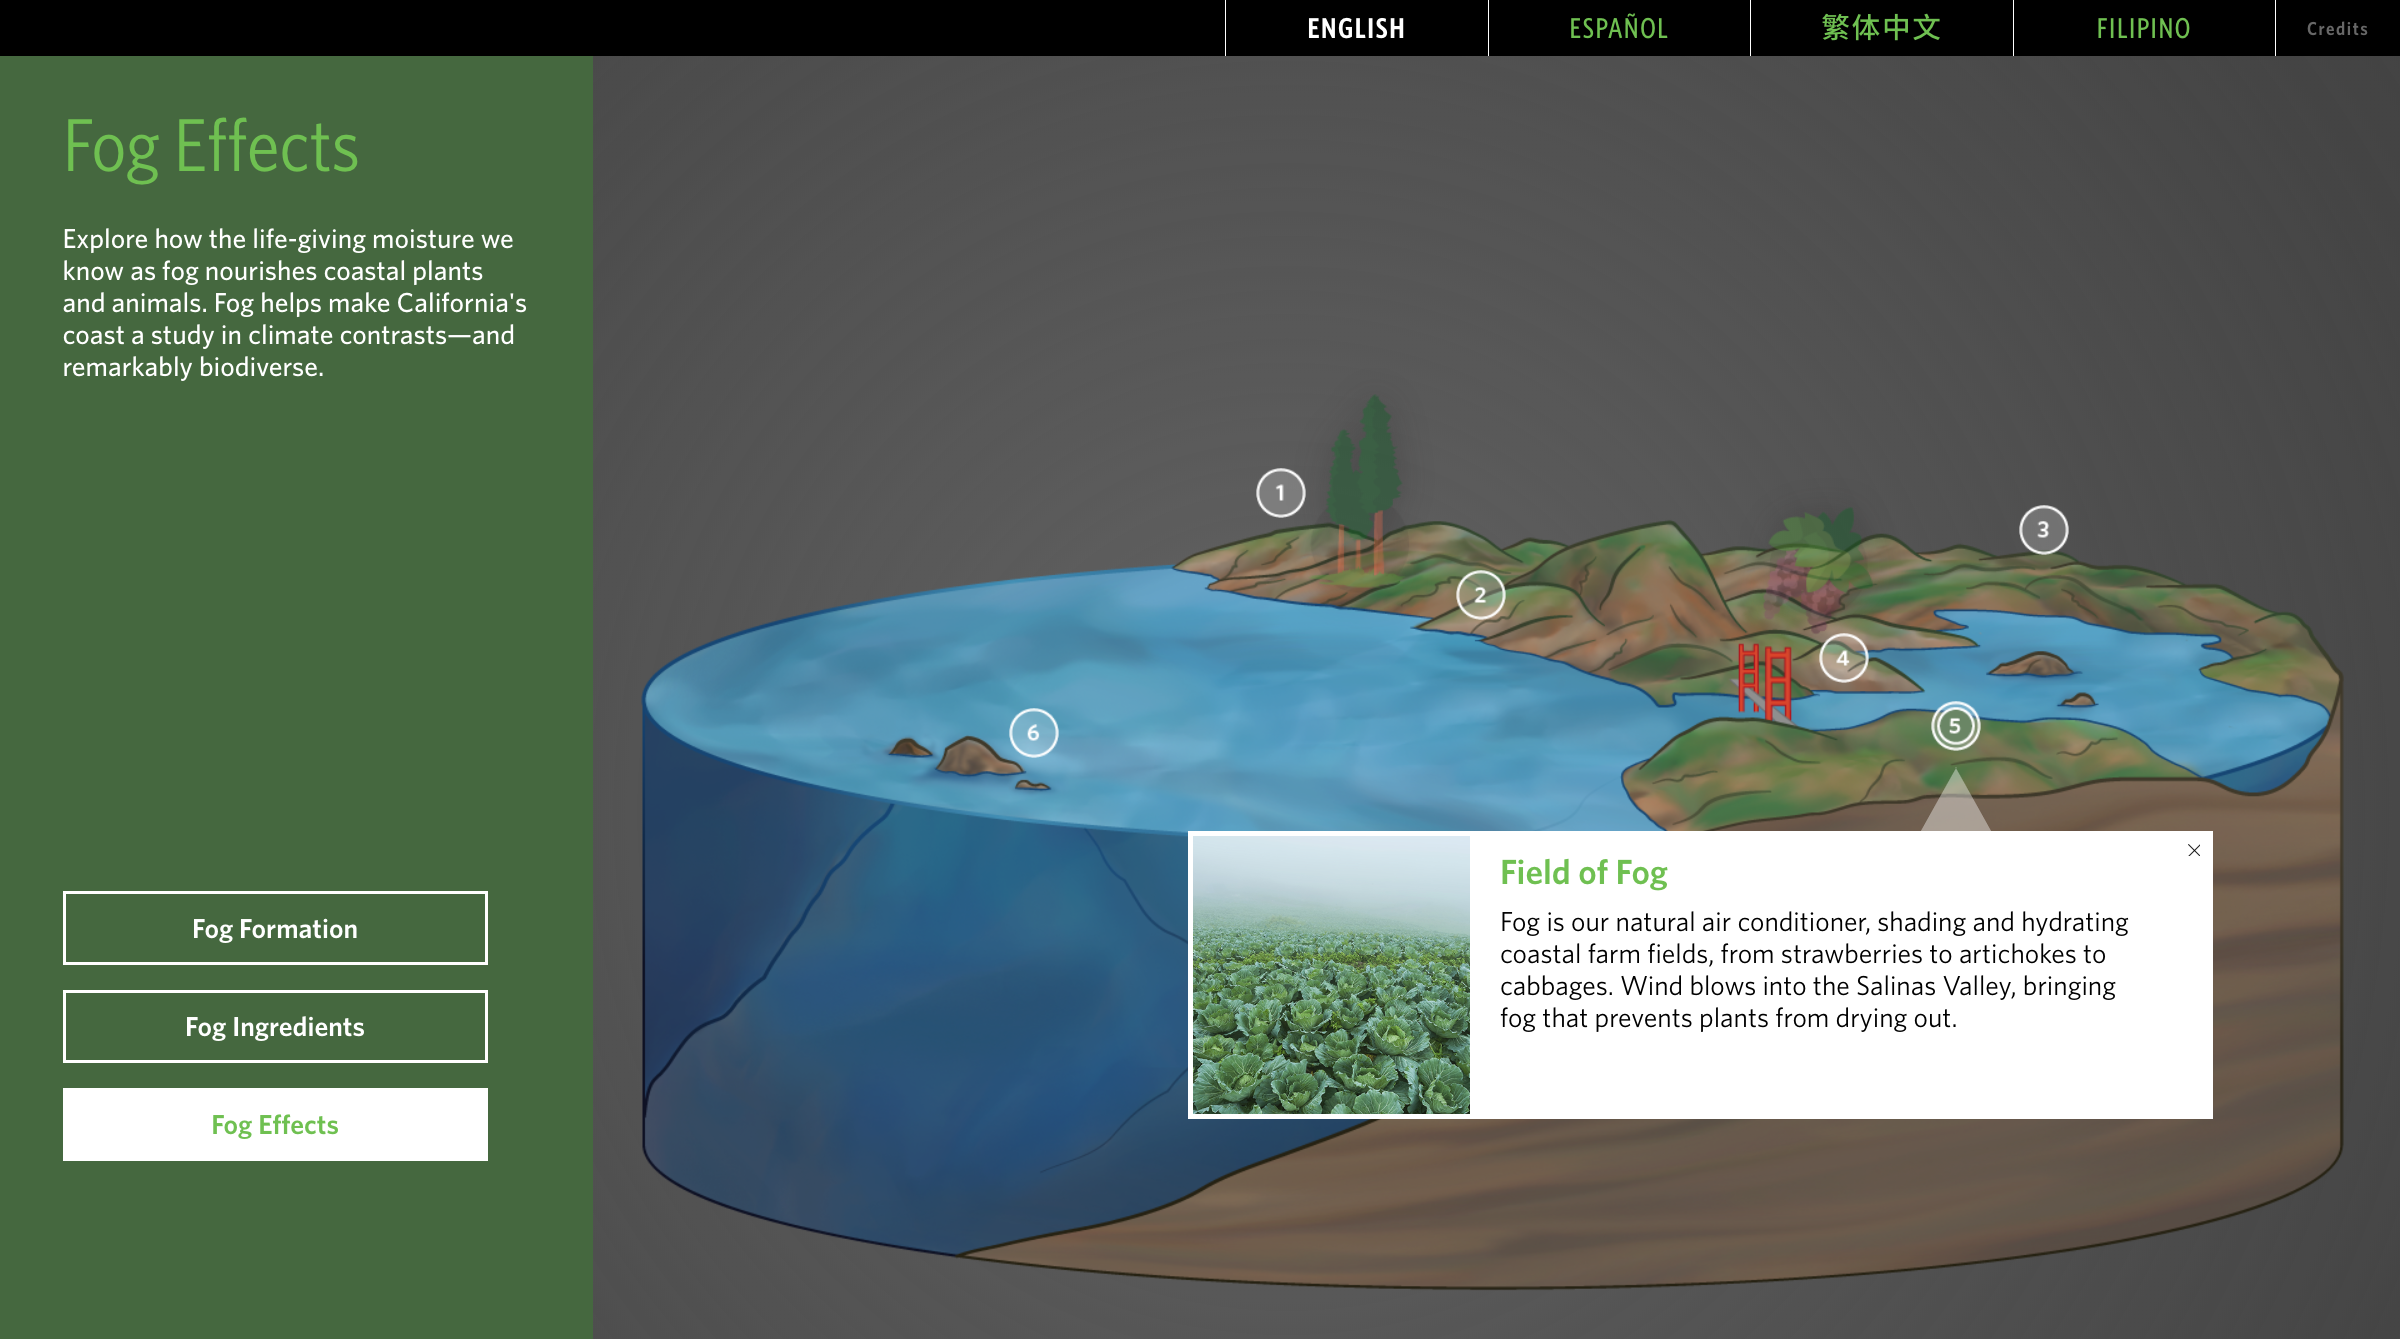
The looping animation shows how fog is important for crops grown in the Bay Area.

The looping animation shows how the fog plays a roll in refilling watersheds.
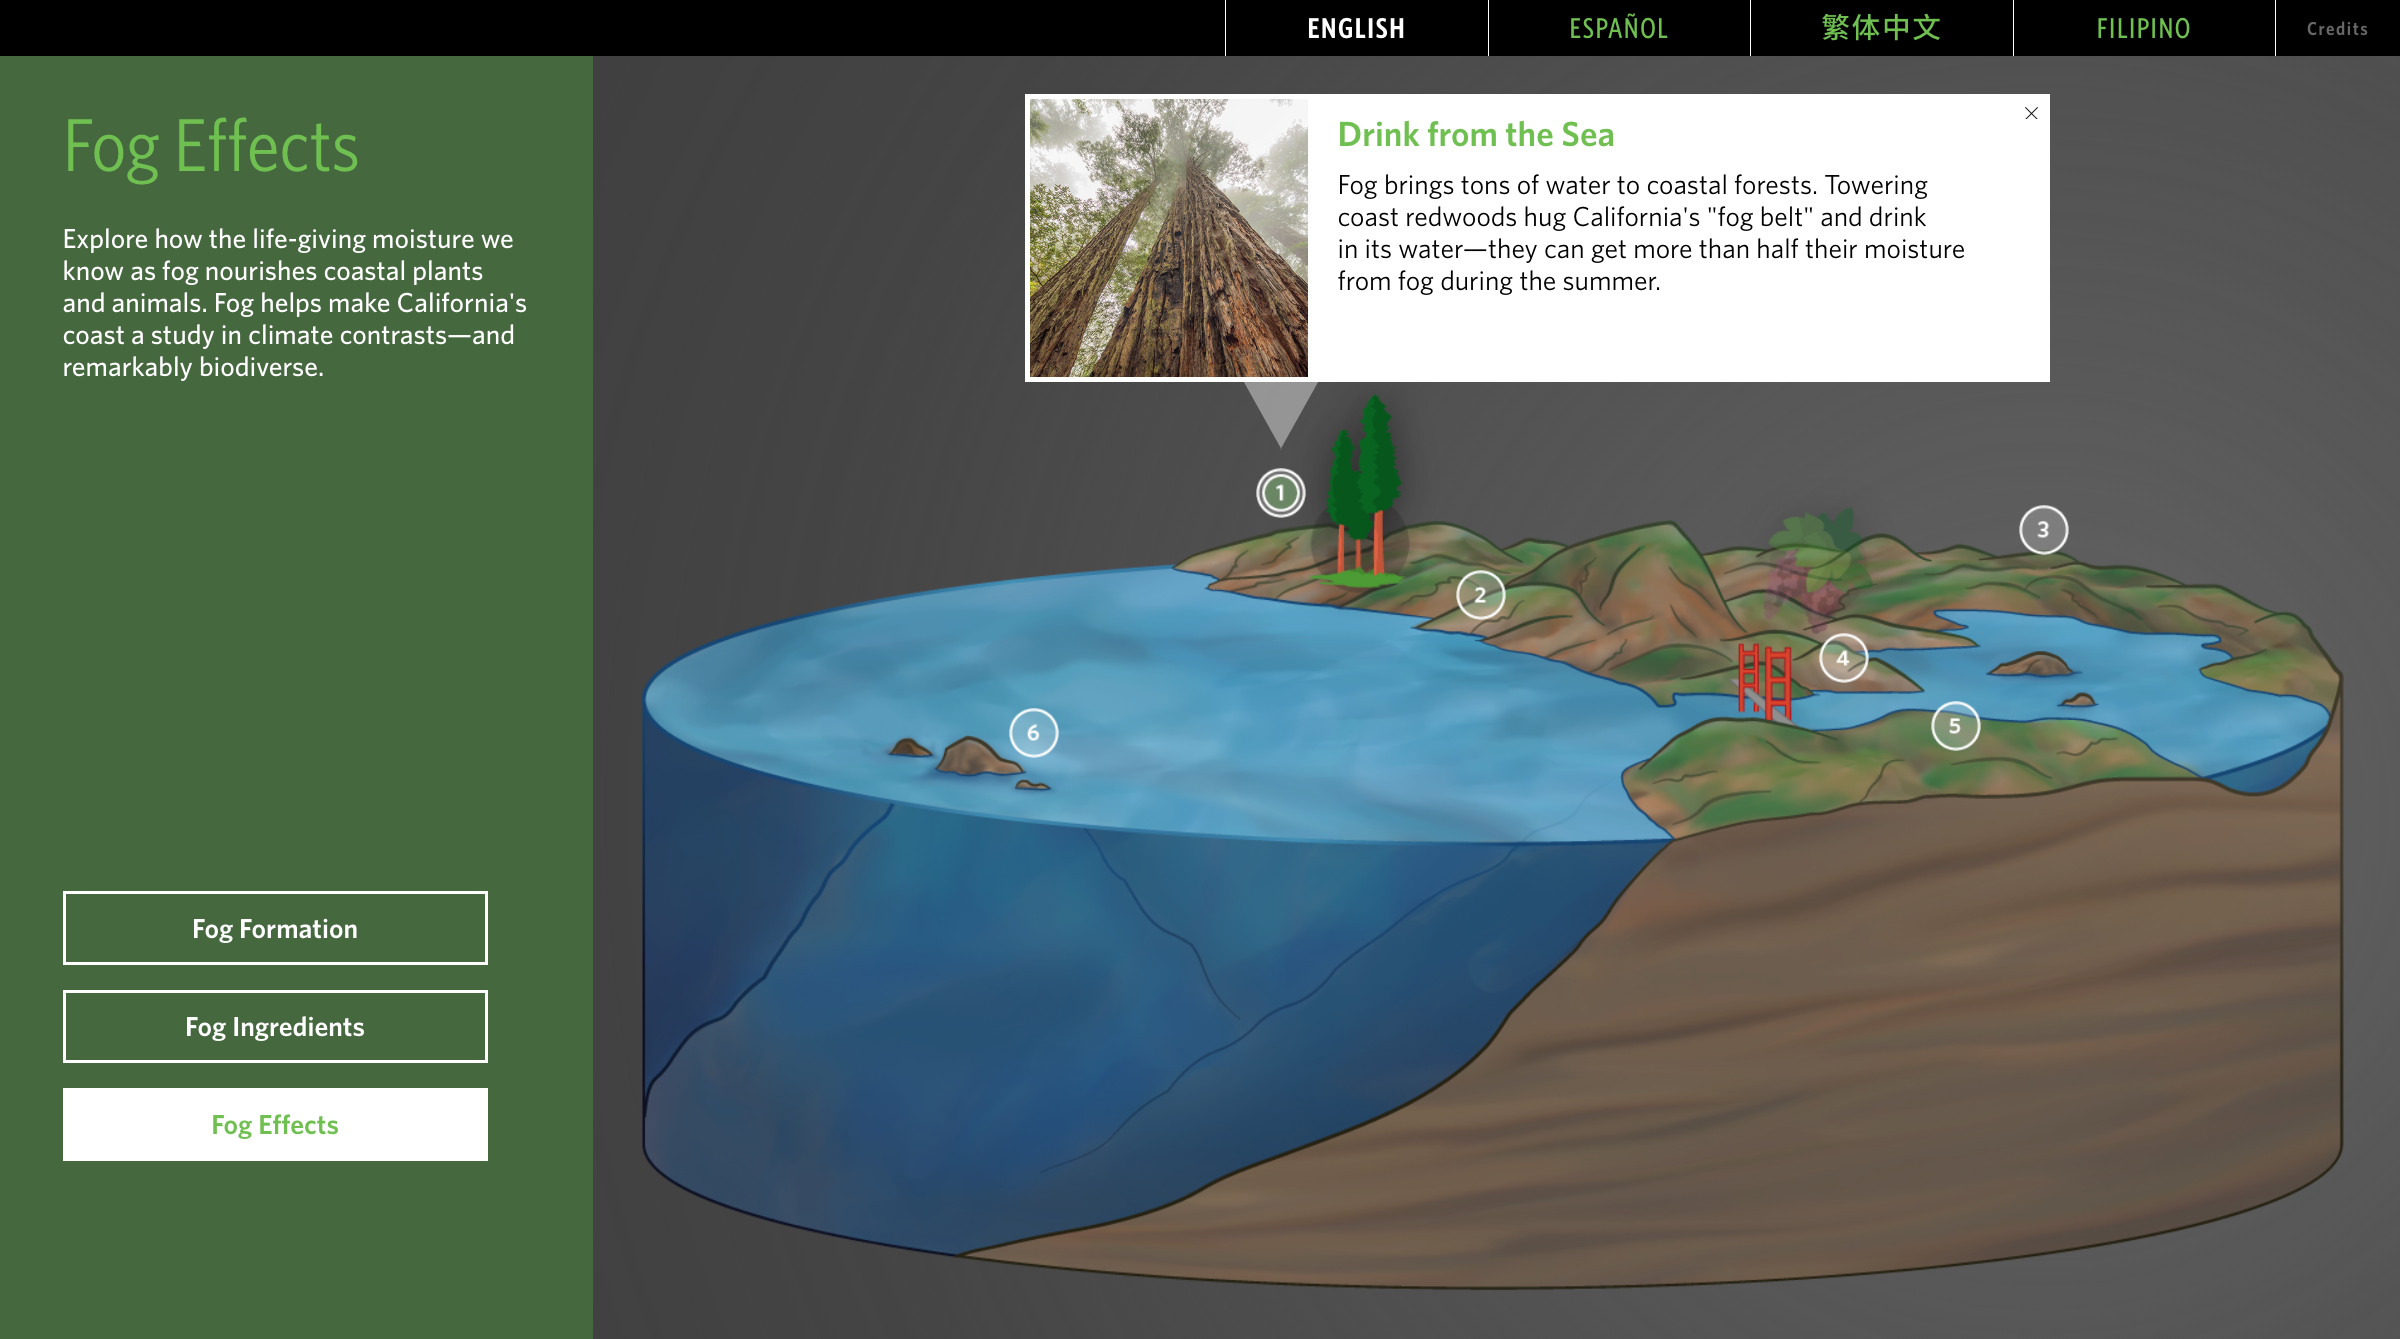
When selecting the hotspots near the redwood tree illustration about how fog works and the role it plays in the Northern California coast.
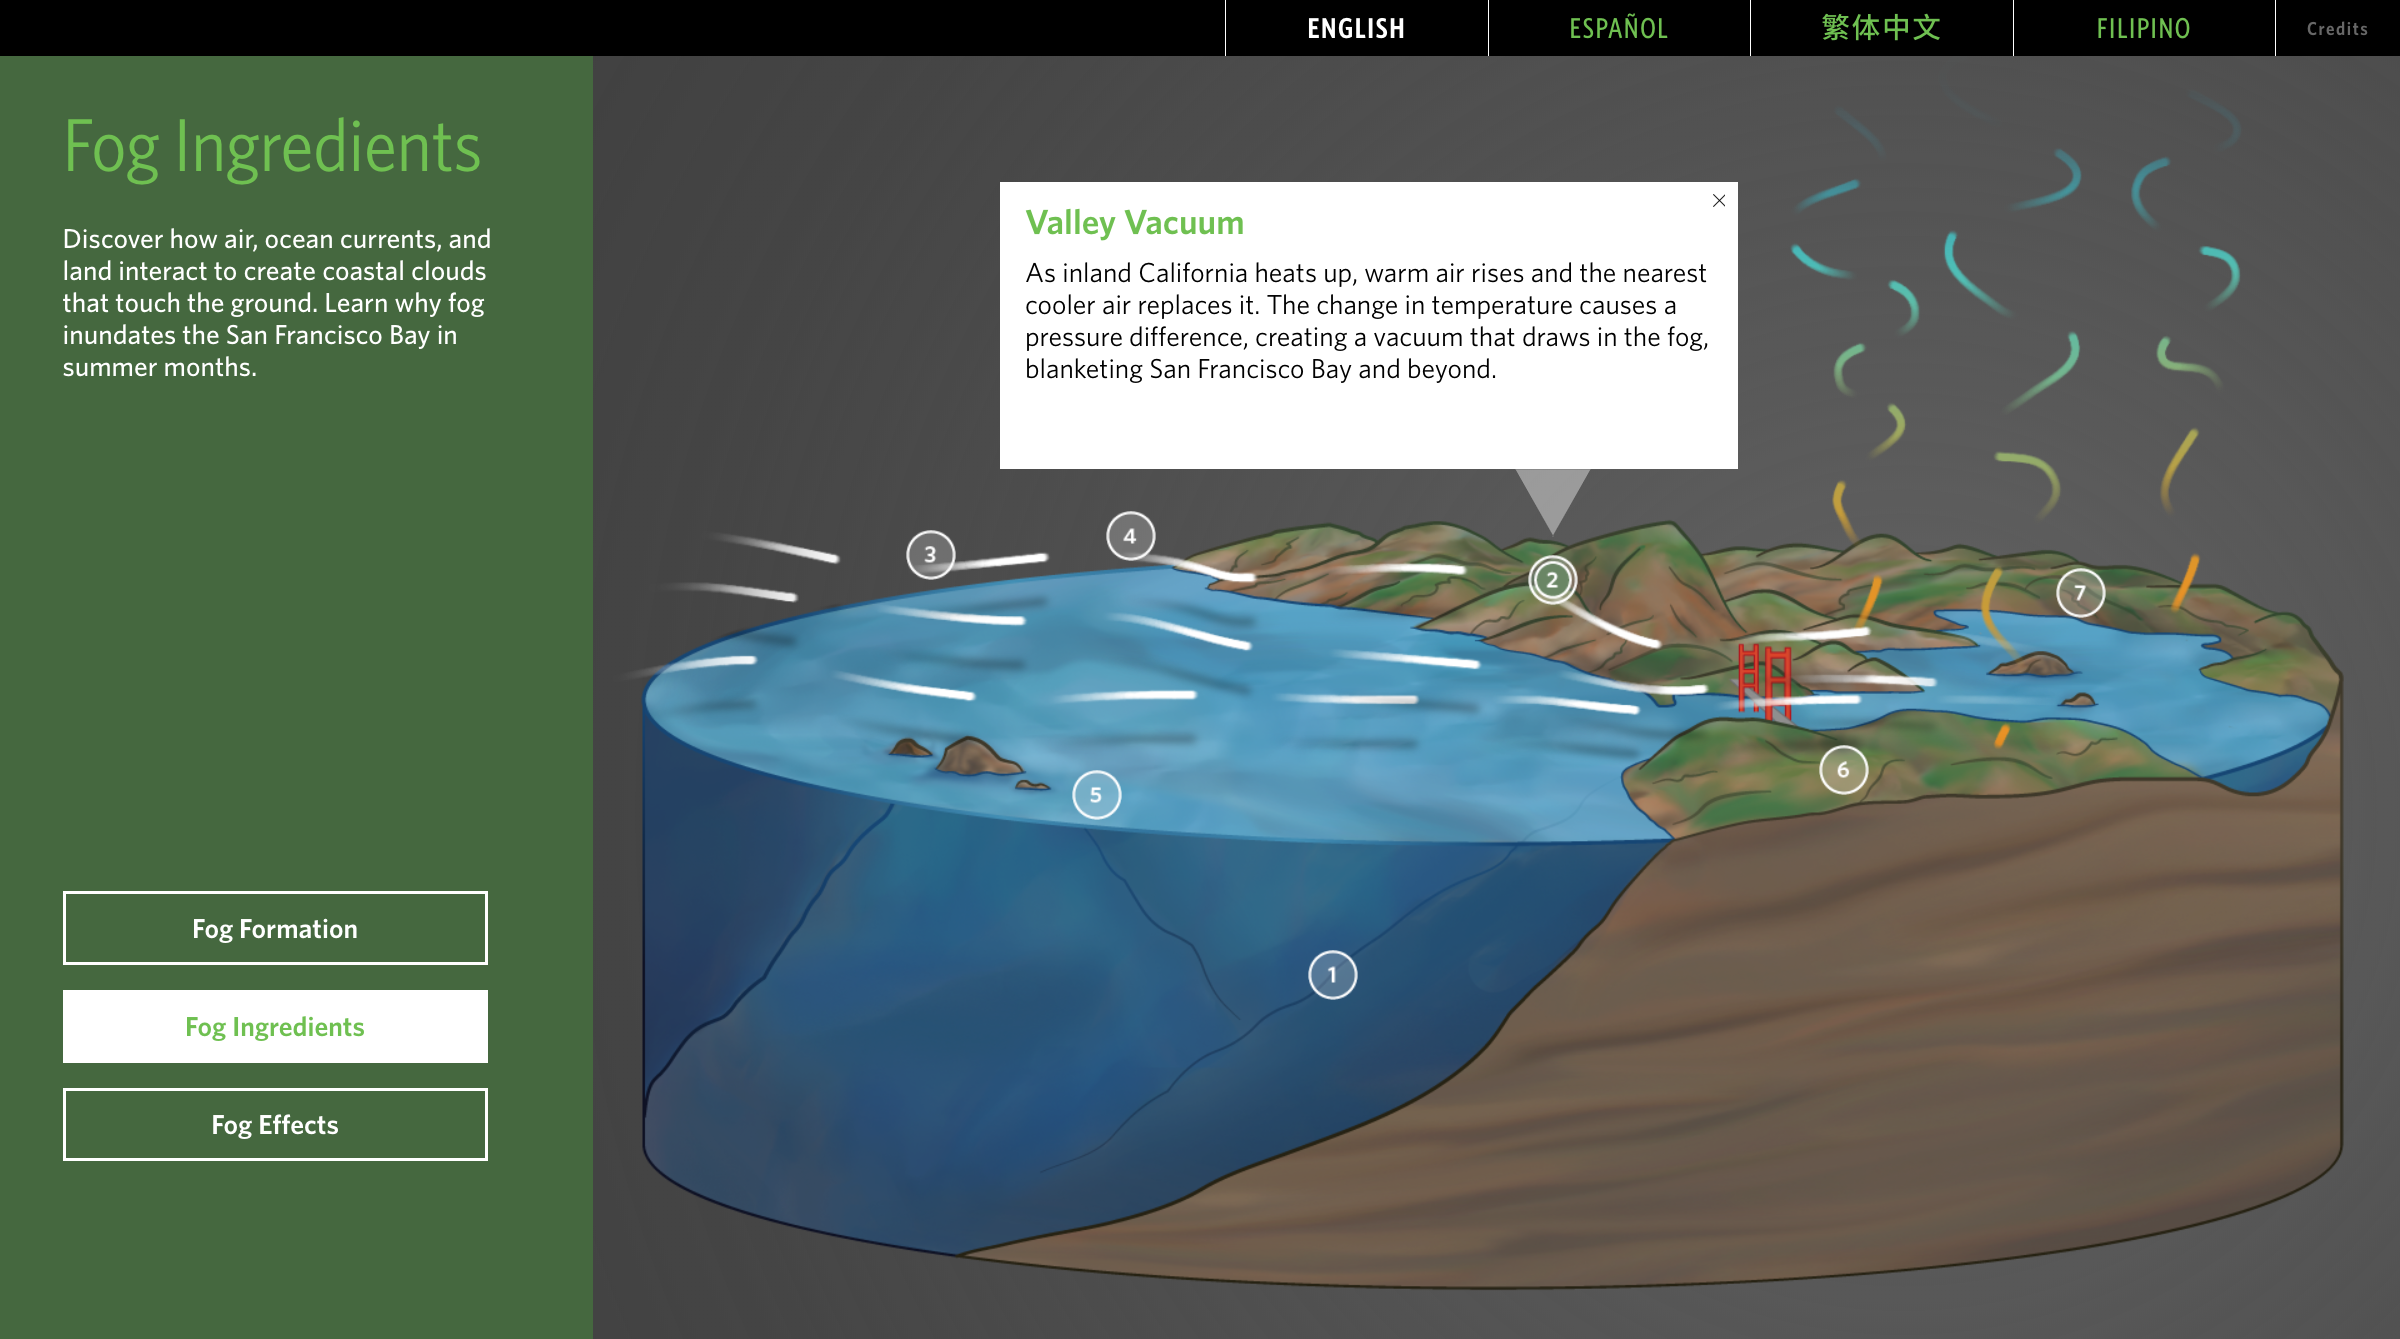
The looping animation shows how cold air moves over the ocean and rises as it heats over the land.

The looping animation shows how fog can be thick like a blanket.
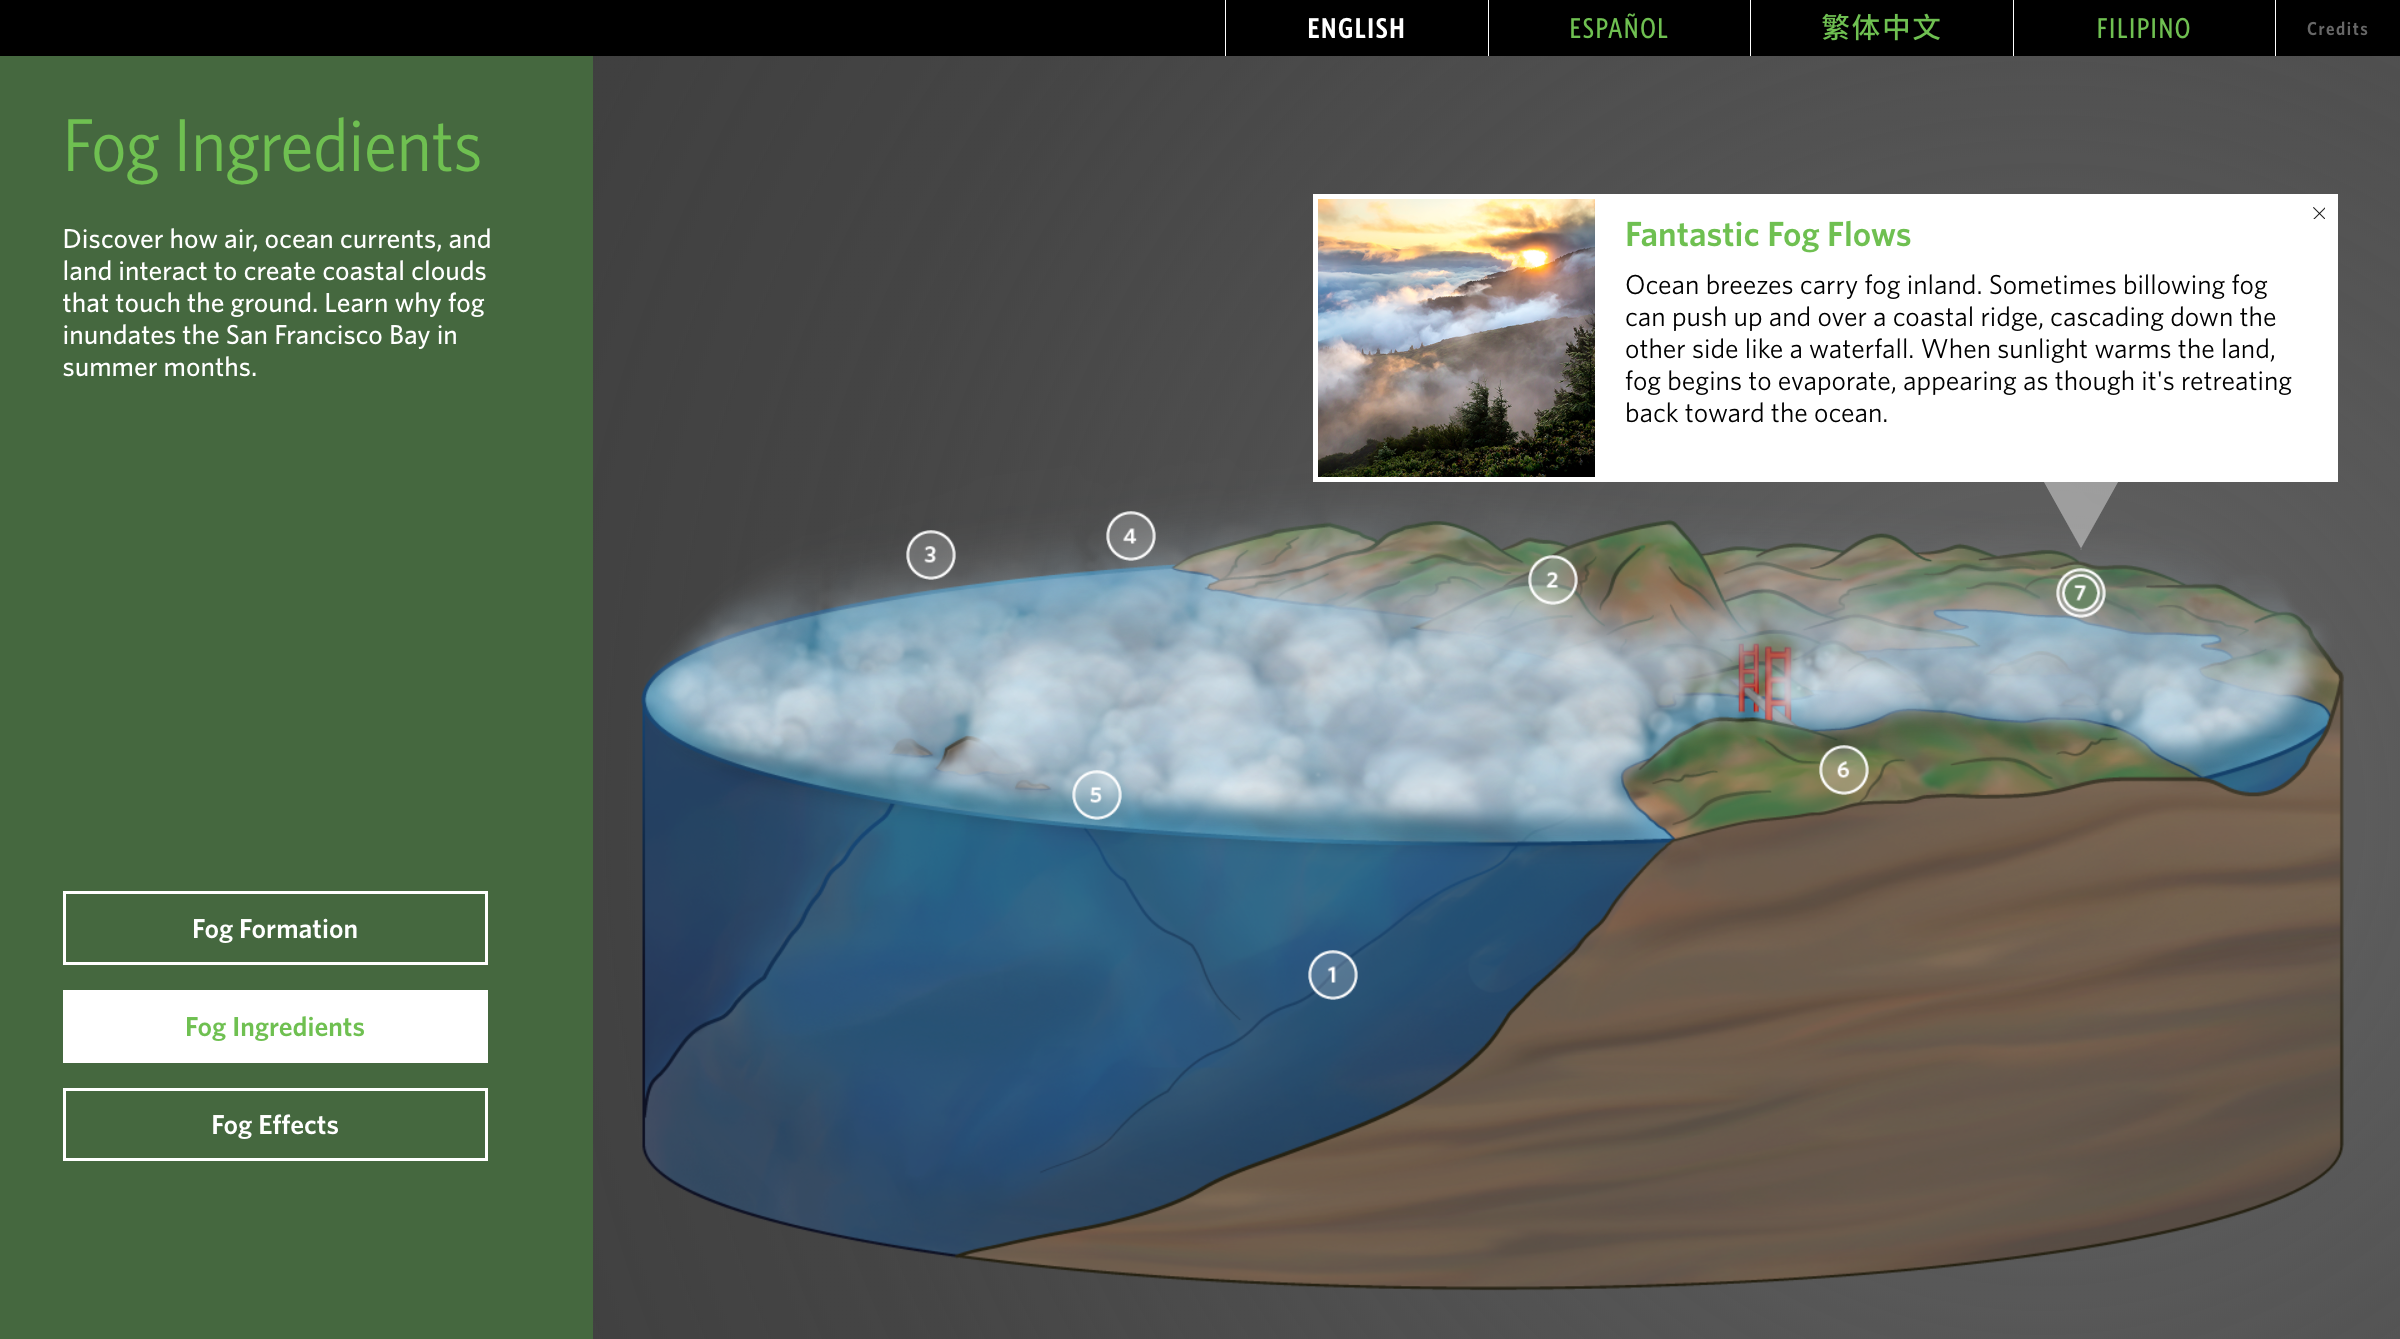
The looping animation shows the cyclical movement of fog.
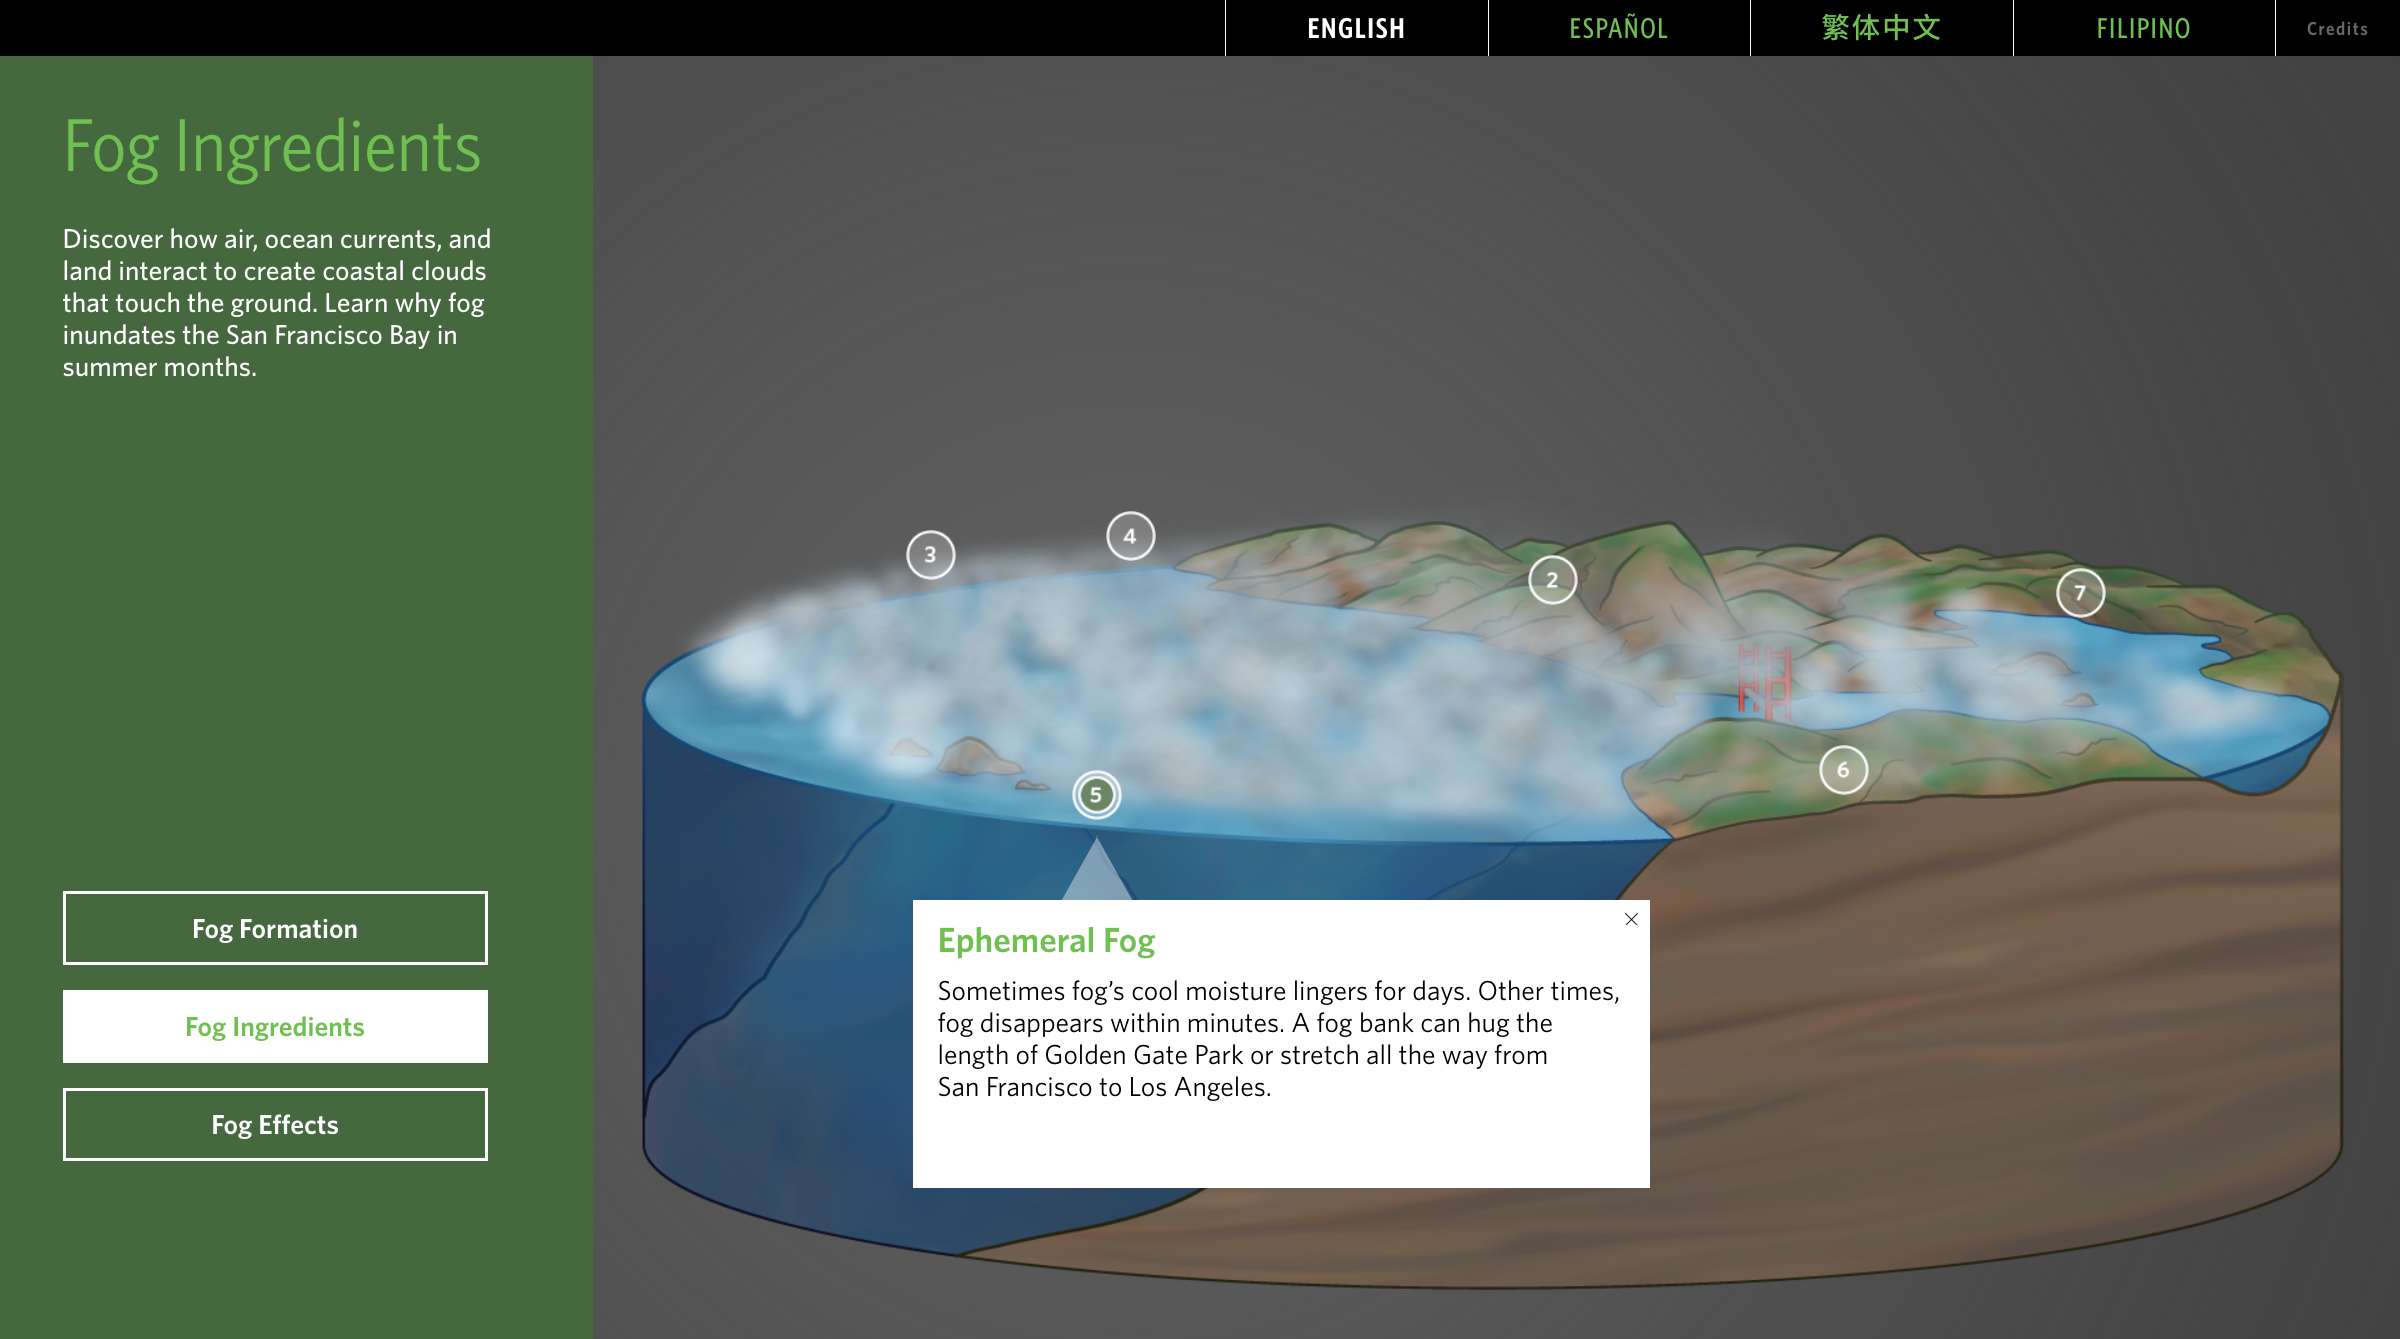
The looping animation shows fog sometimes lingers and sometimes disappears quickly.
Clickthrough of the Ocean Upwelling touchscreen as part of 3 Systems to show the UX and animations
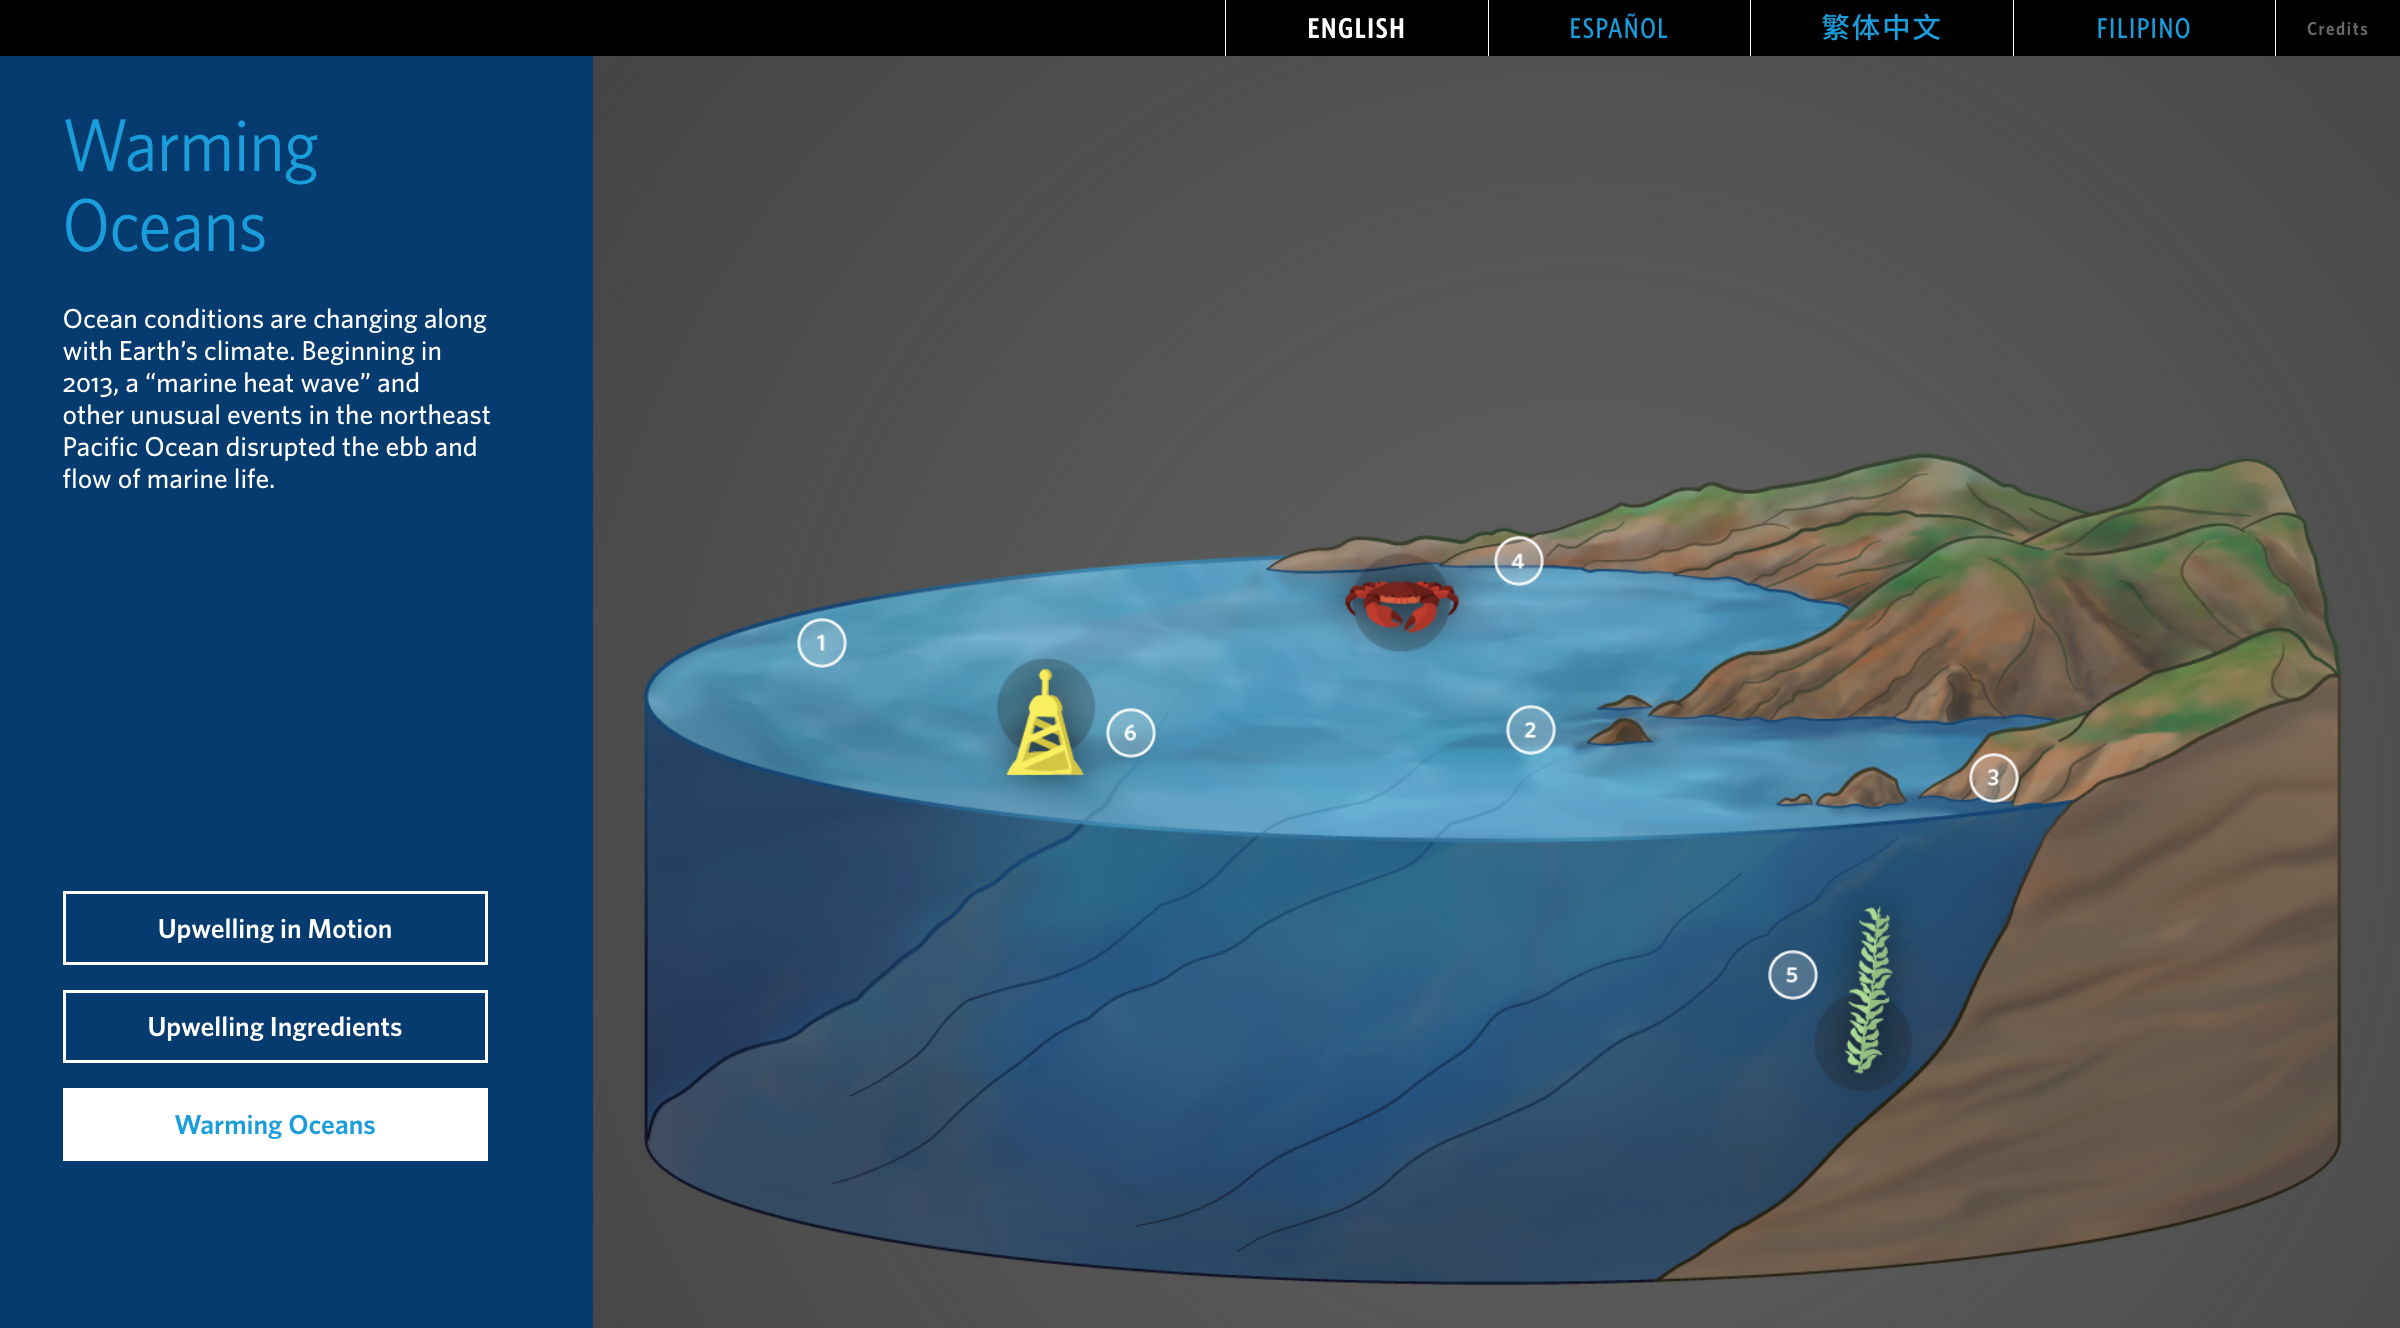
By clicking different hotspots (next to illustrations and parts of the landmass), pop up content and animations are triggered.

The looping animation shows the current moving along the coastline.

The looping animation shows ocean upwelling, moving from the deep ocean up along the coast.

The looping animation shows plankton's role in the upwelling cycle.

When selecting the hotspot near the kelp illustration, with pop up content about how kelp forests are important to many species.
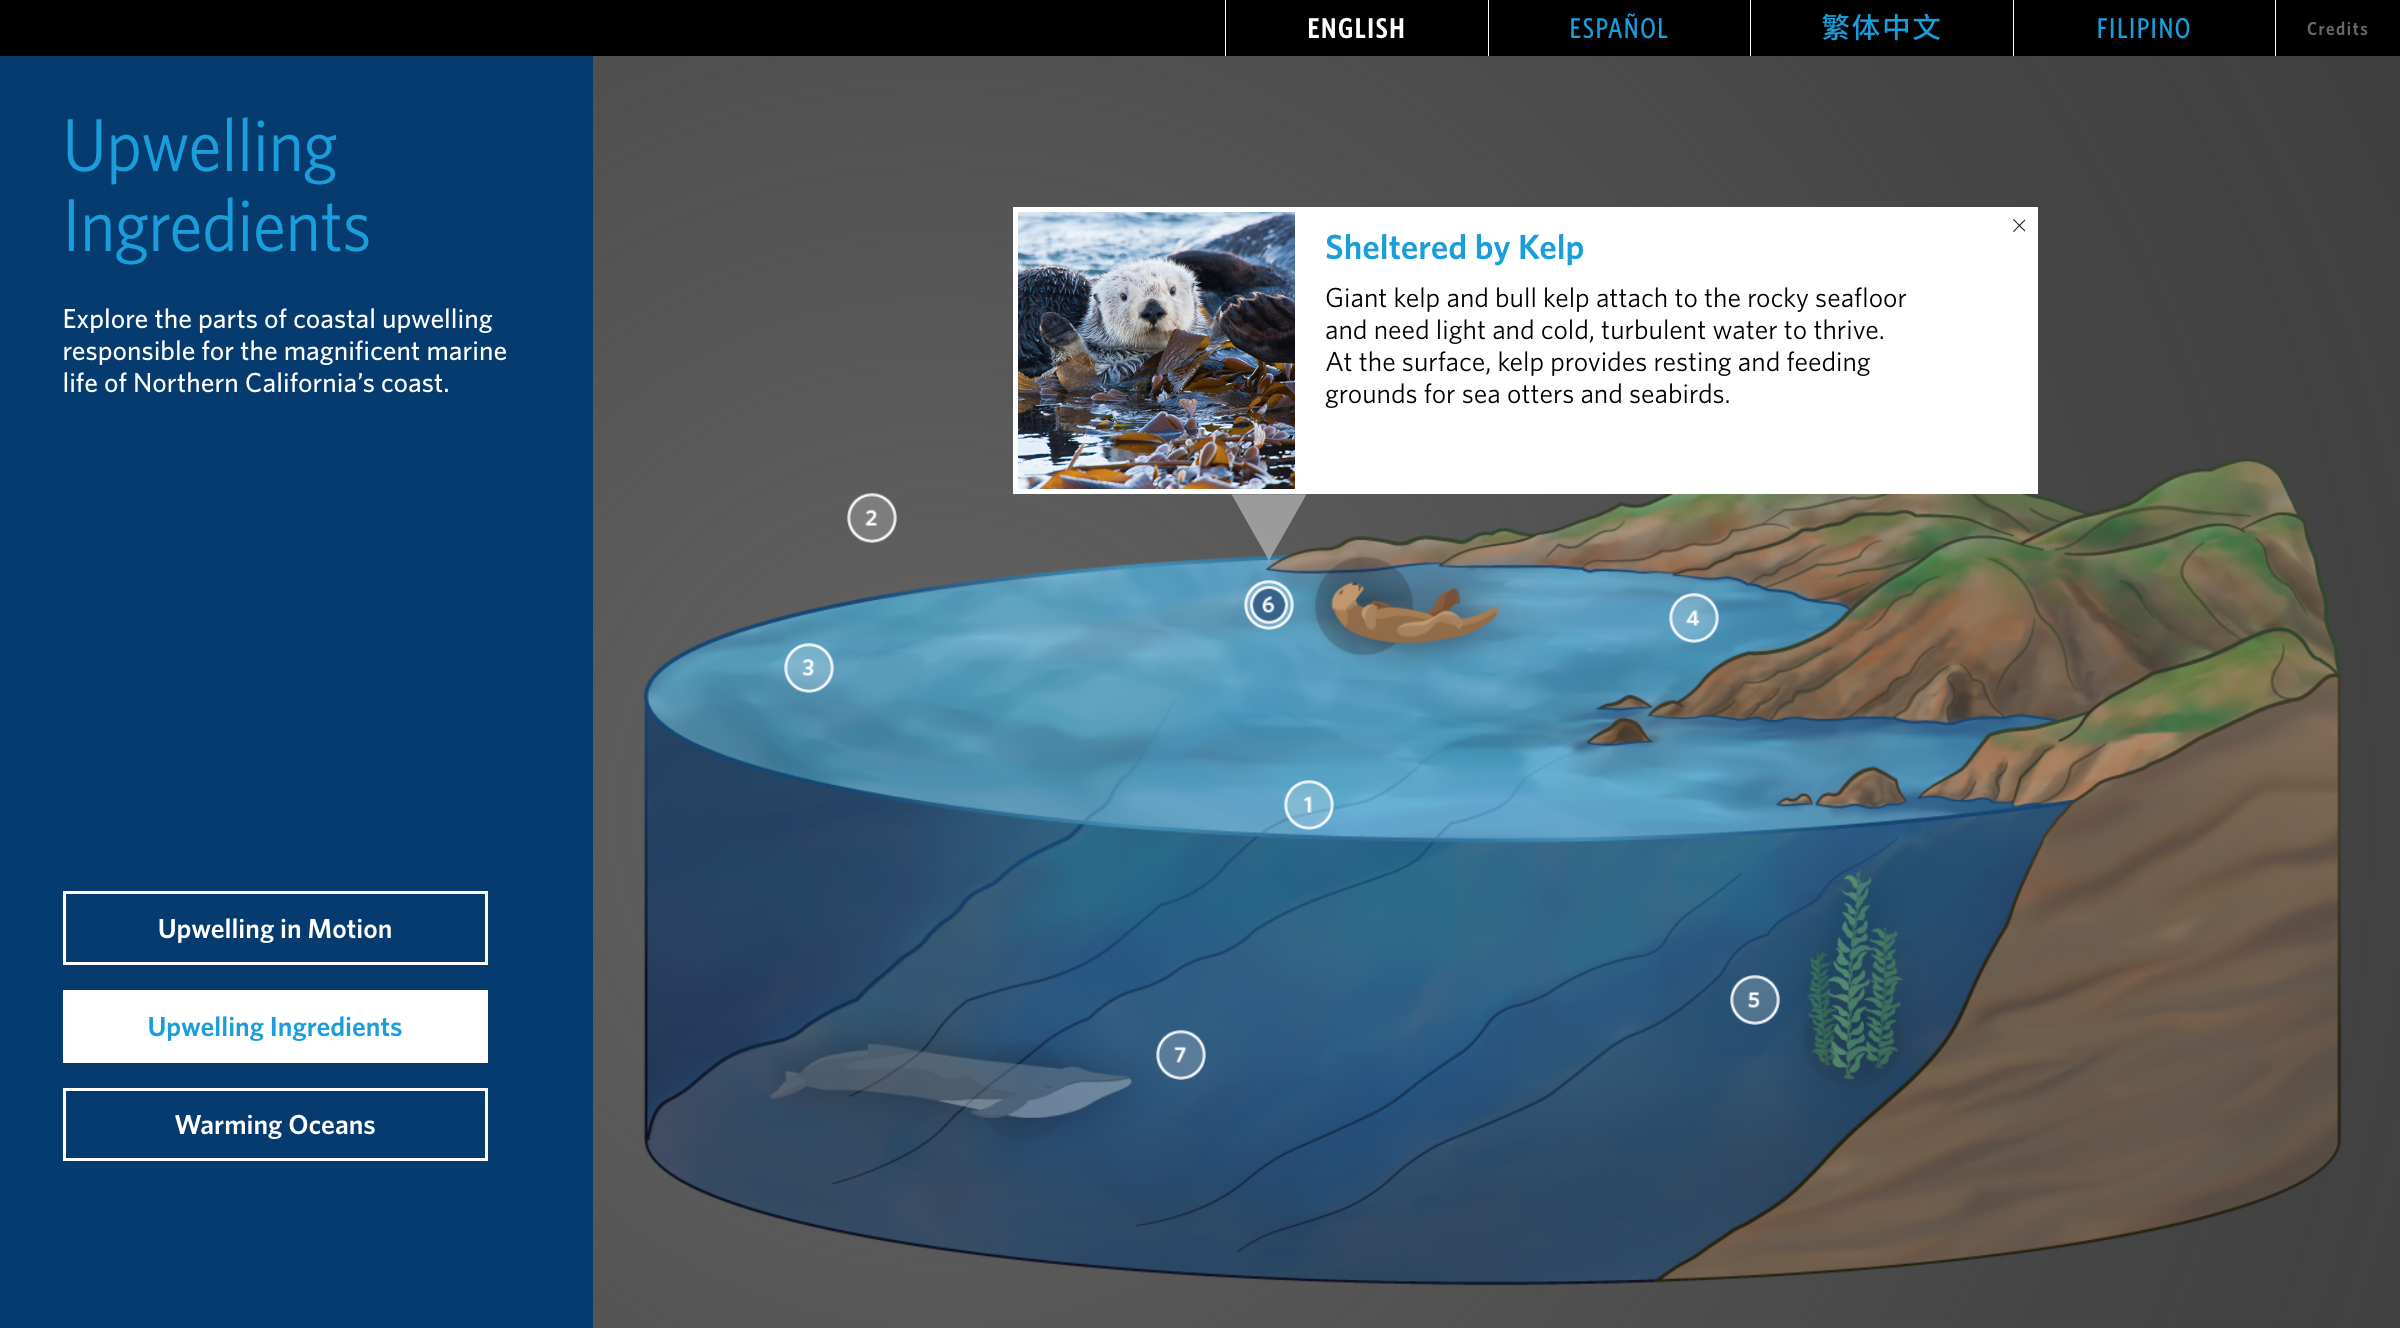
When selecting the hotspot near the otter illustration, with pop up content about how otters use the kelp for protection.
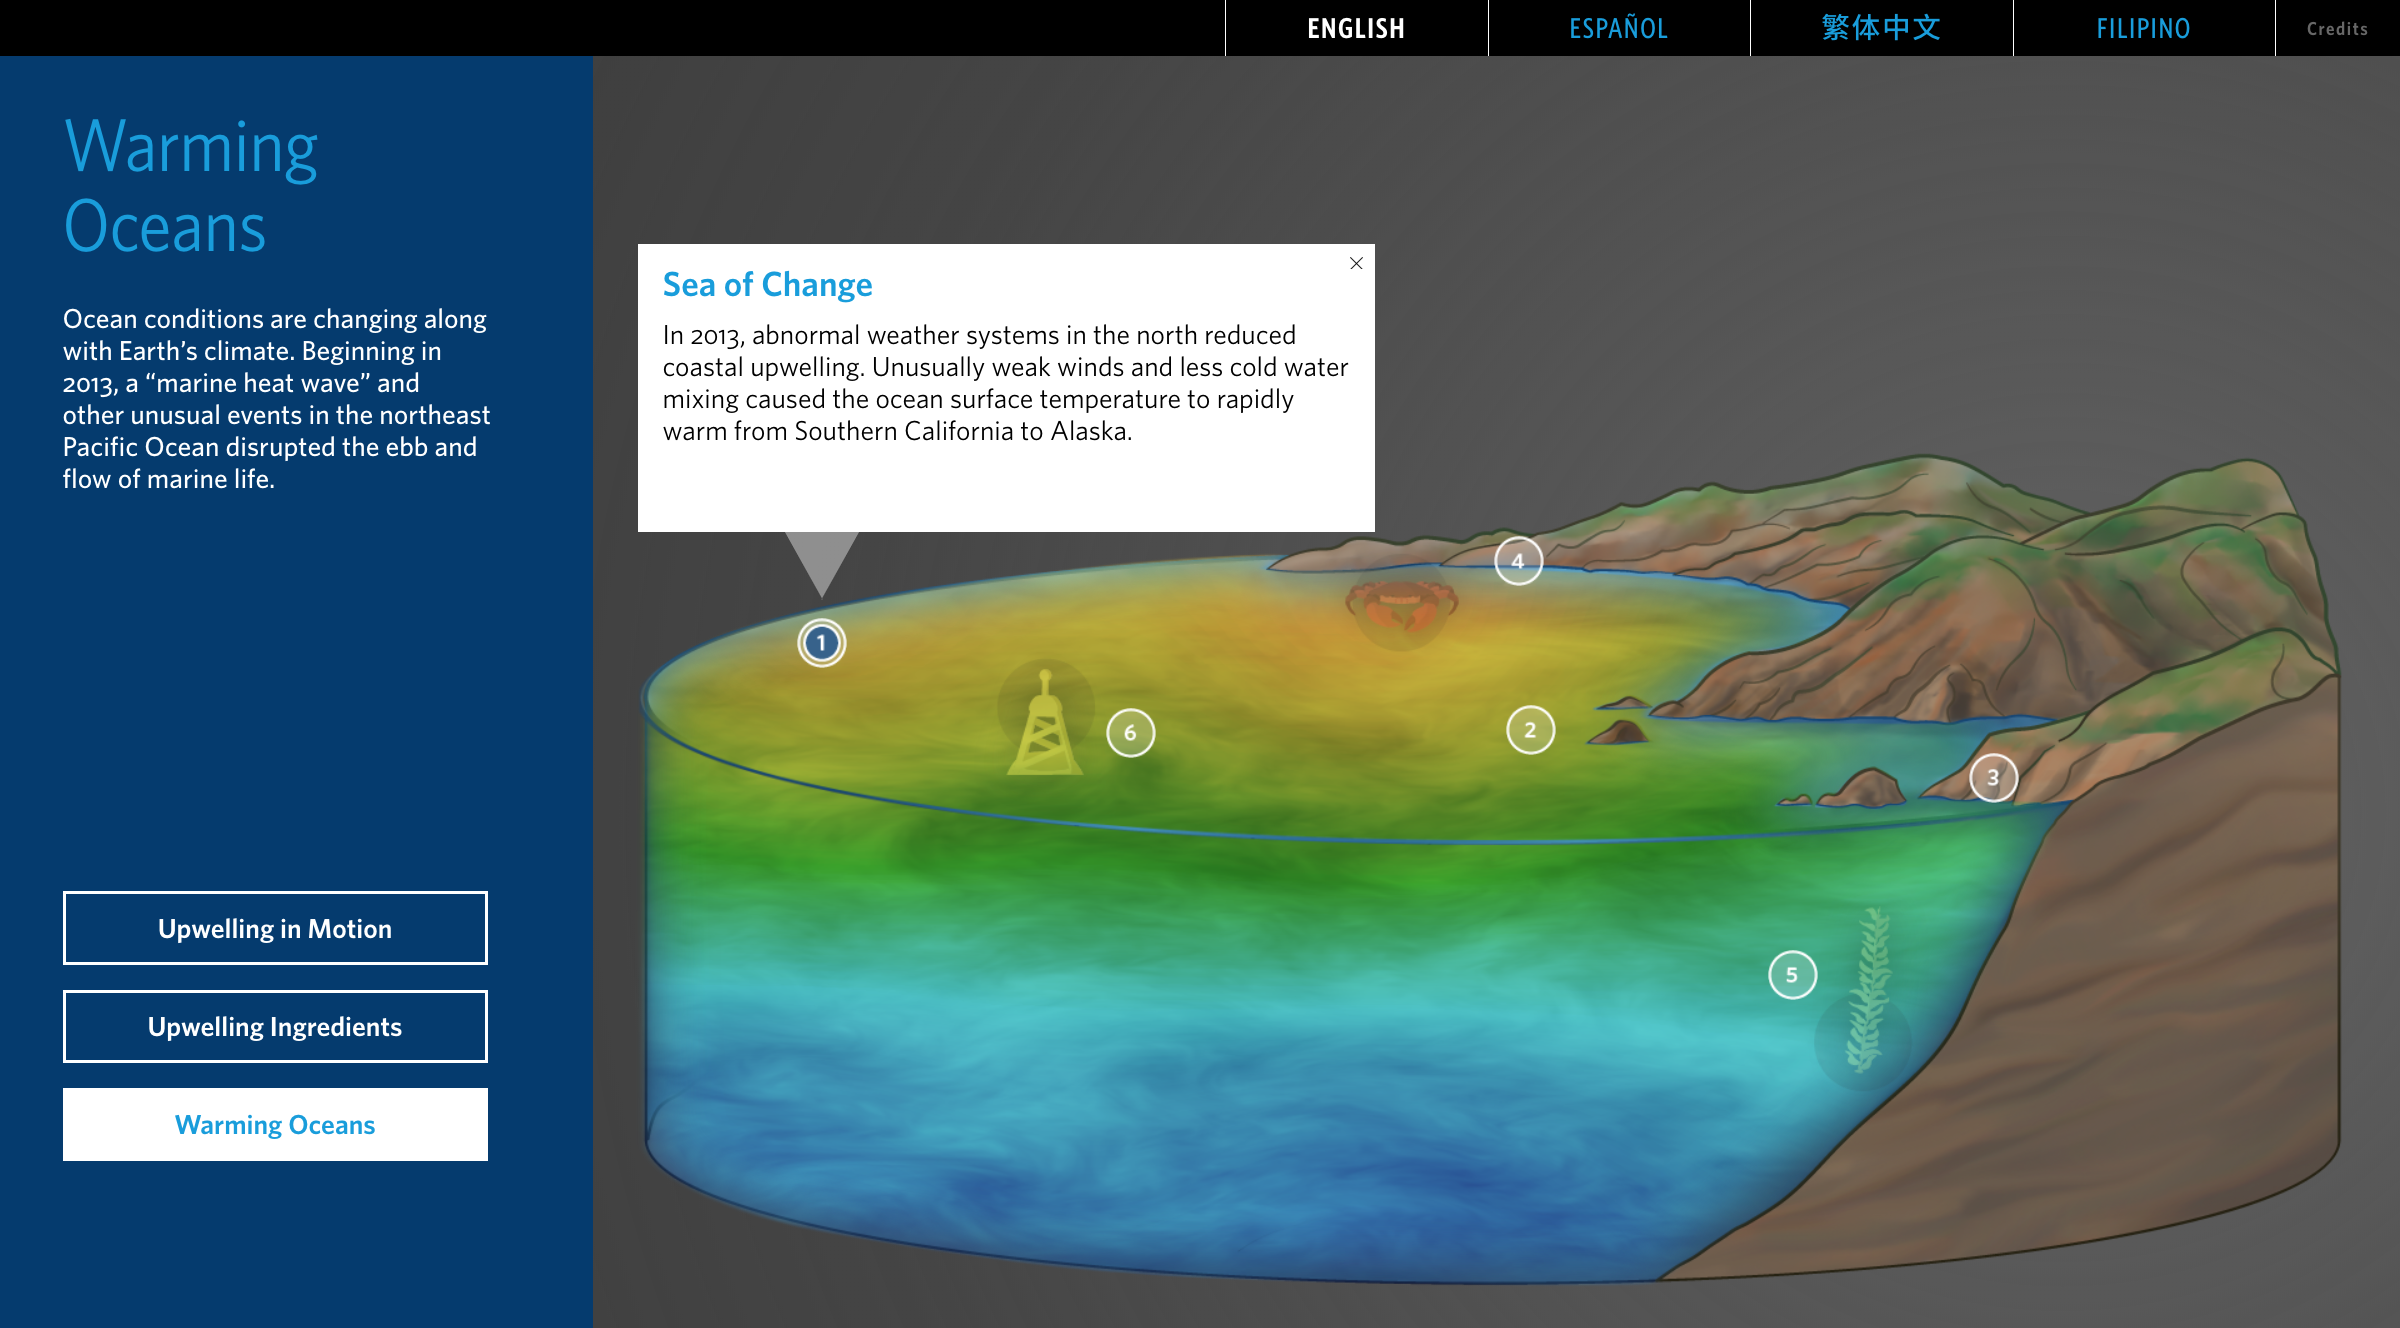
The looping animation shows the temperature of the water changing.
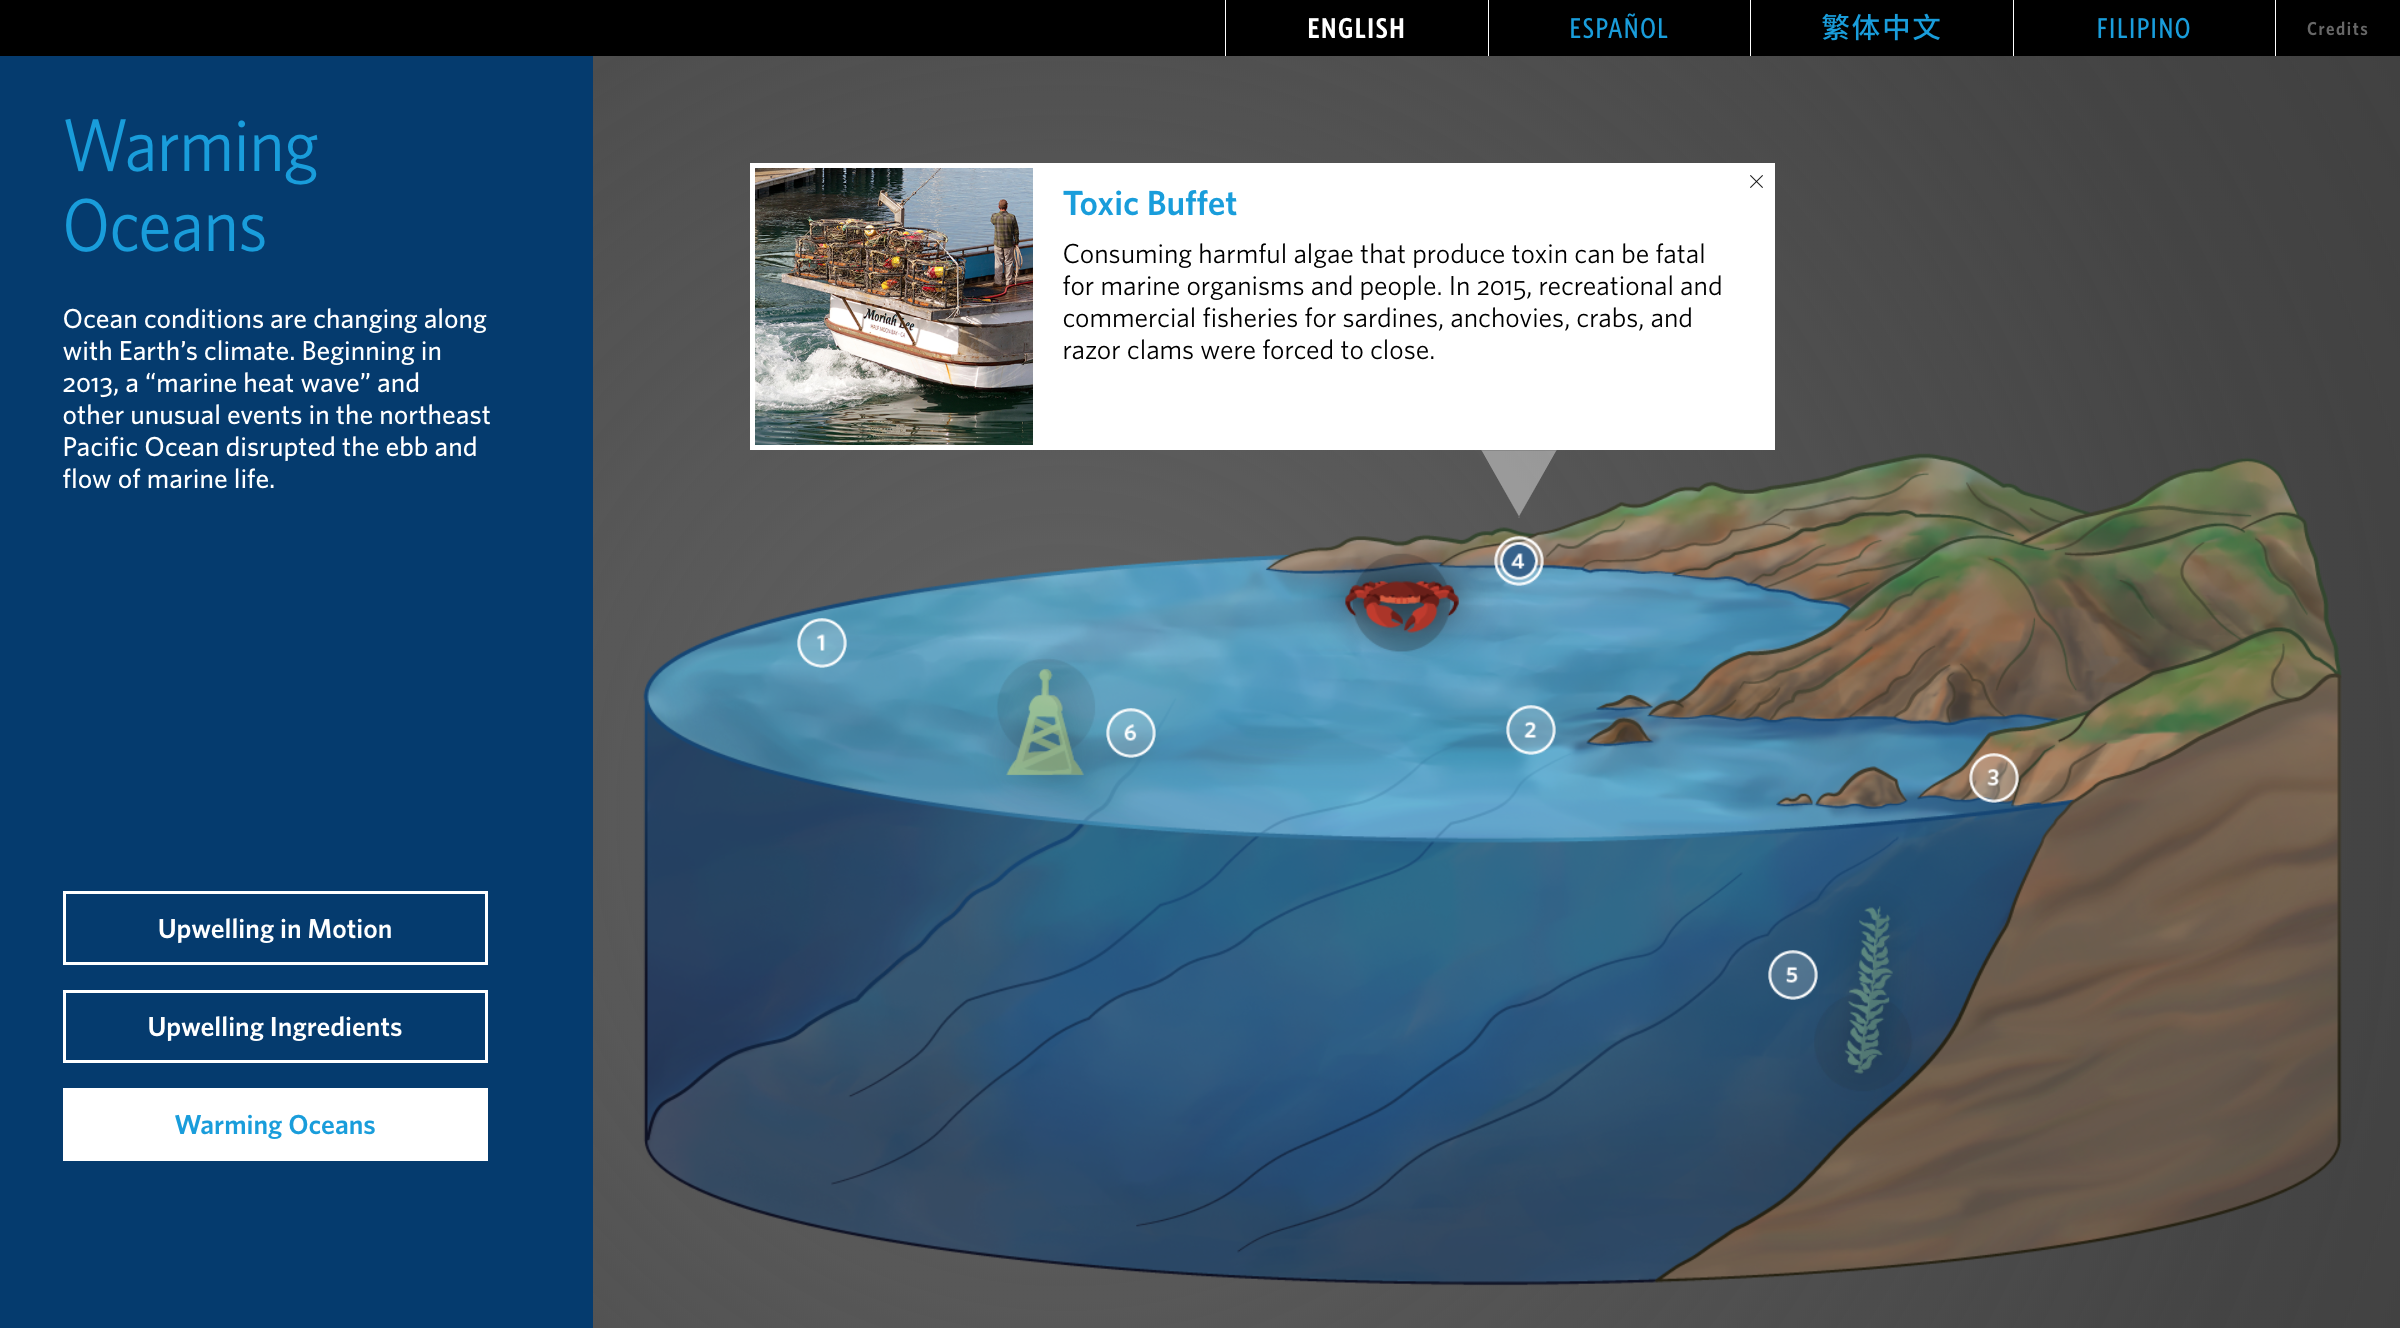
When selecting the hotspot near the crab illustration, with pop up content about how toxic algae impacts consumer seafood.
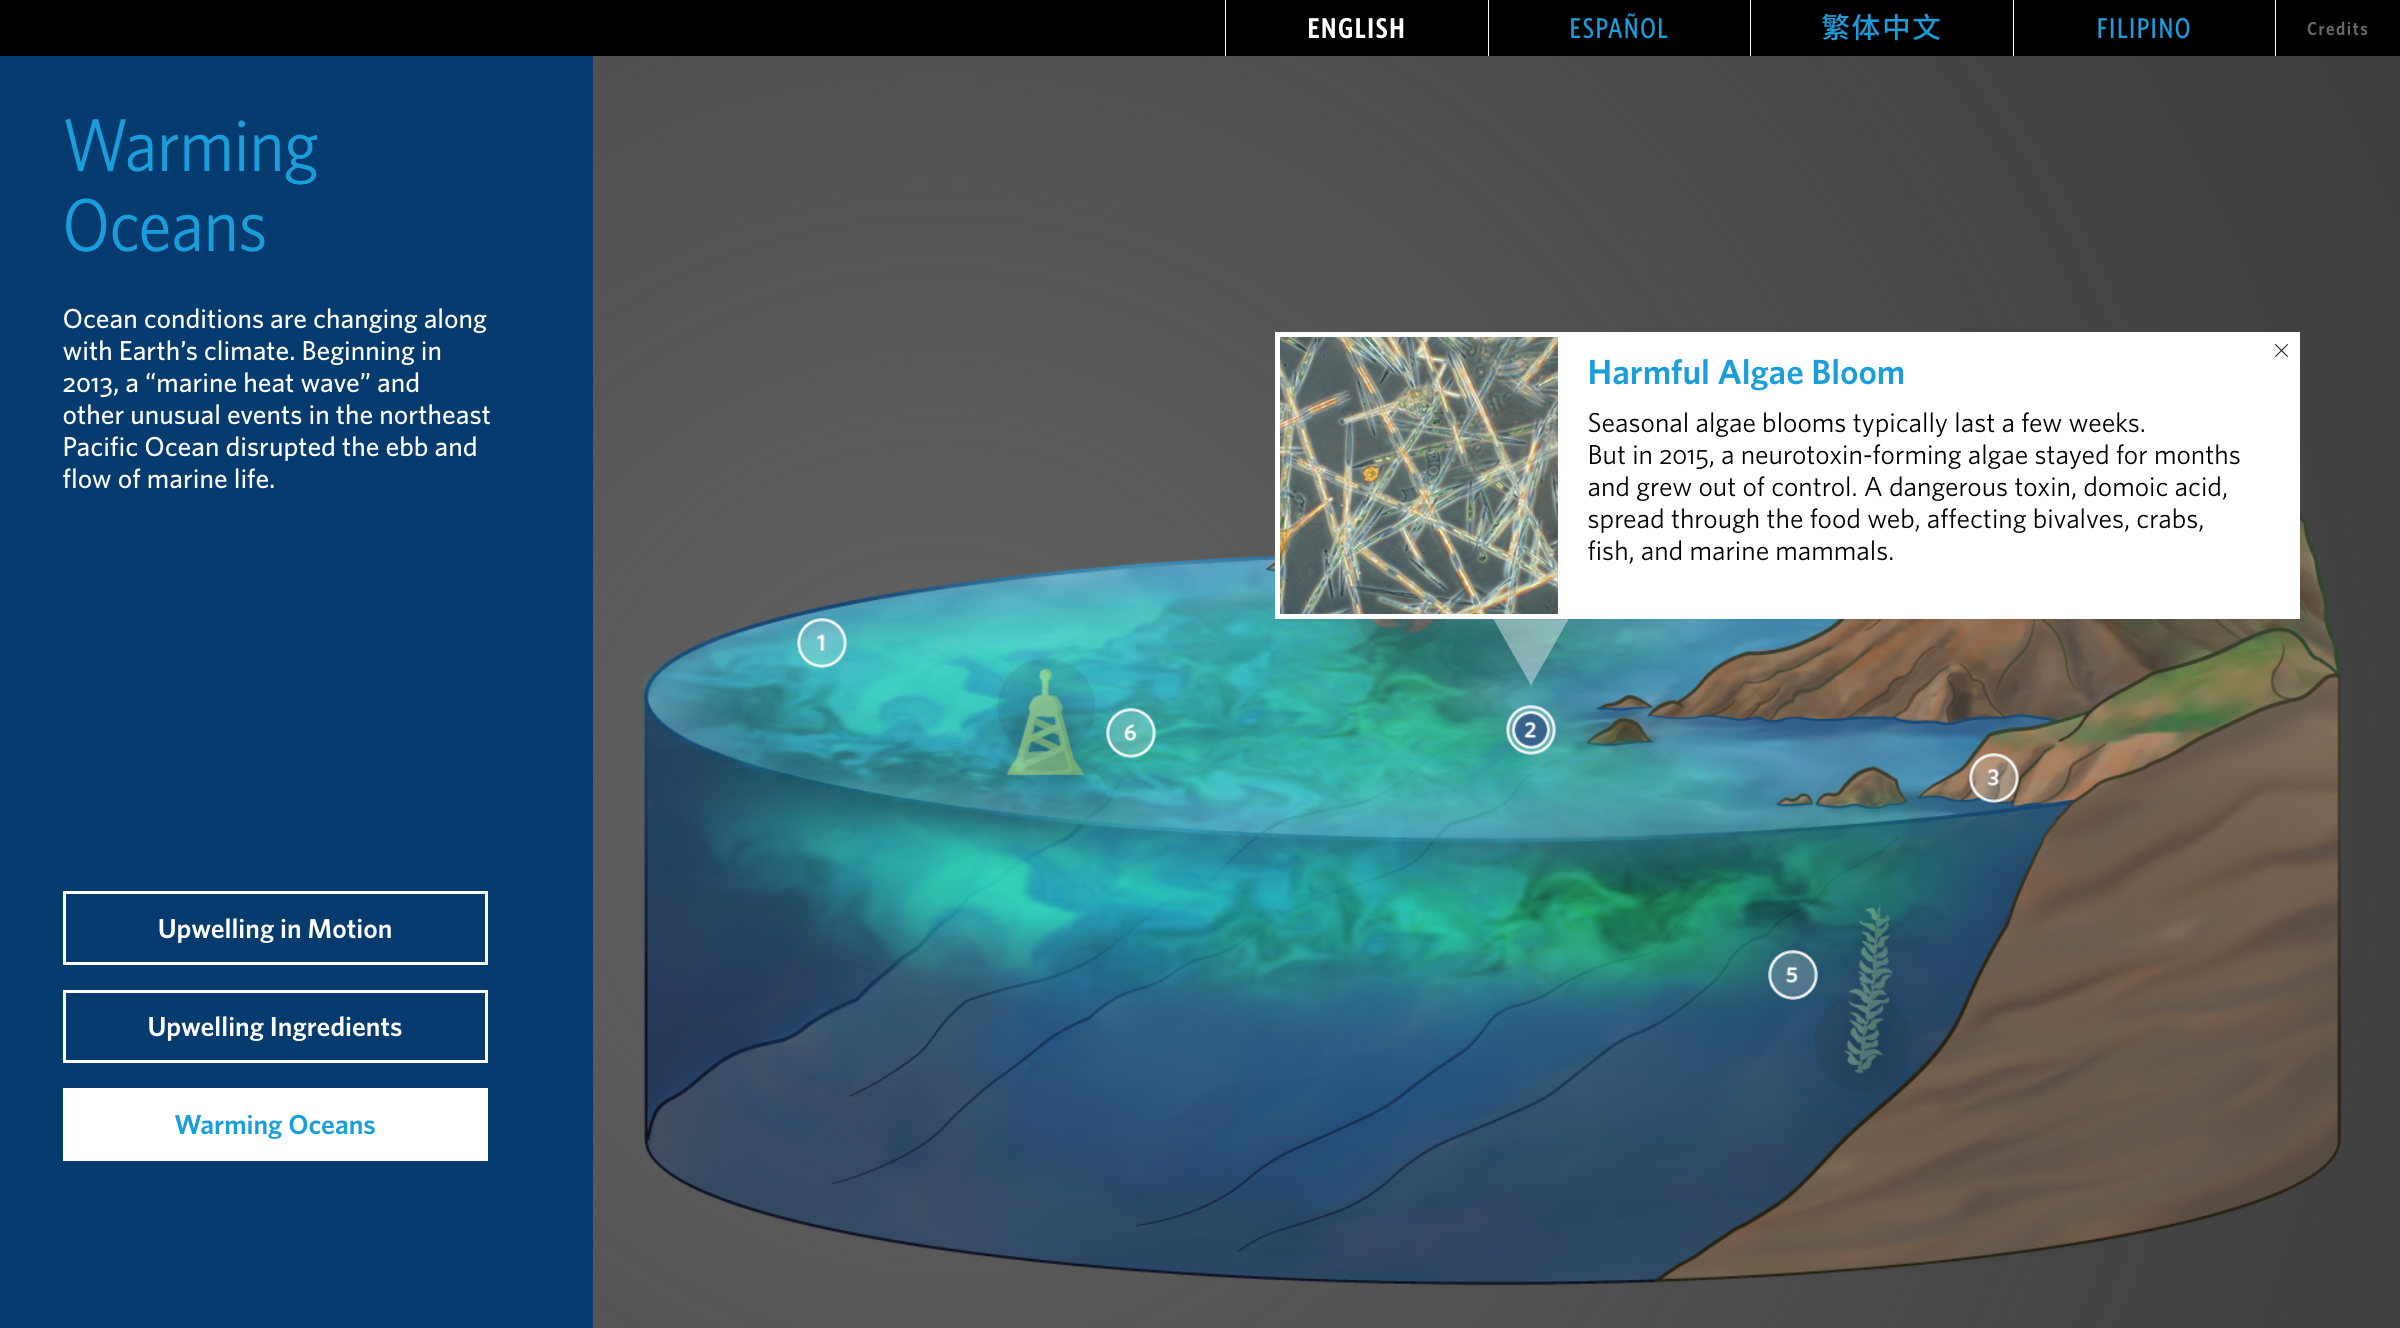
The looping animation shows an algae bloom.

When selecting the hotspot near the bull kelp seaweed illustration, with pop up content about urchins destroying kelp forests.
The Team
Andrew Sawyer – Visual Design, Animation & UX
Anna Simmons – Content
James Davidson – Illustration
Kat Whitney – Photography
Josh Ause – Web Development
Ken Ackerman – Animation